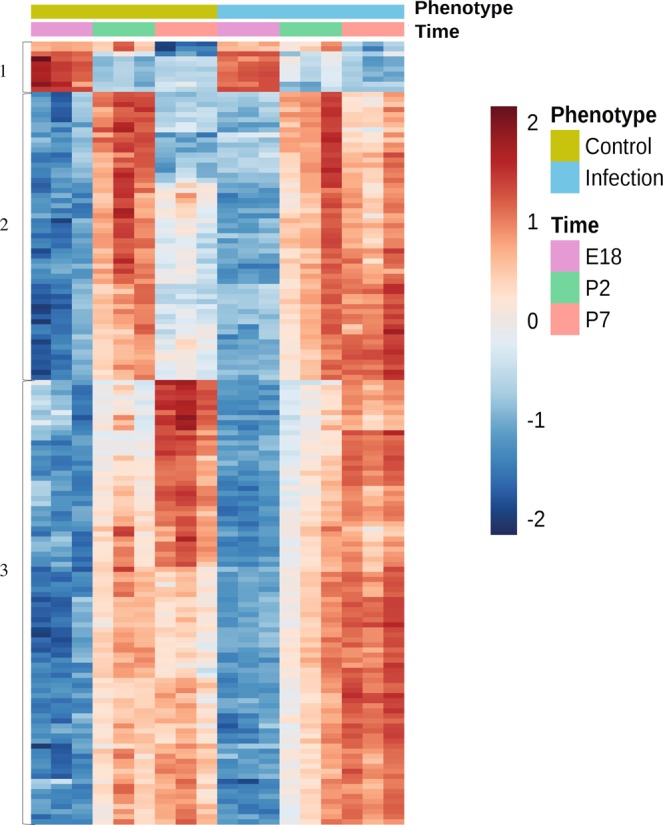
Figure 2.

Heatmap generated after elimination of non-significant genes by ANOVA2 with Bonferroni multiple testing revealing 3 temporal patterns of differential gene expression between control and infection groups at embryonic day 18 (E18), postnatal day 2 (P2) and postnatal day 7 (P7). Pattern 1 gene expression was higher on E18 than P2 and P7 in both control and infected groups. Expression of pattern 2 genes increased from E18 to P2 in both control and infected groups and highly expressed at P7 in the infected group but not the control group. Expression of genes in patterns 3 progressively increased from E18 to P2 to P7 irrespective of the infection status of the dams.
