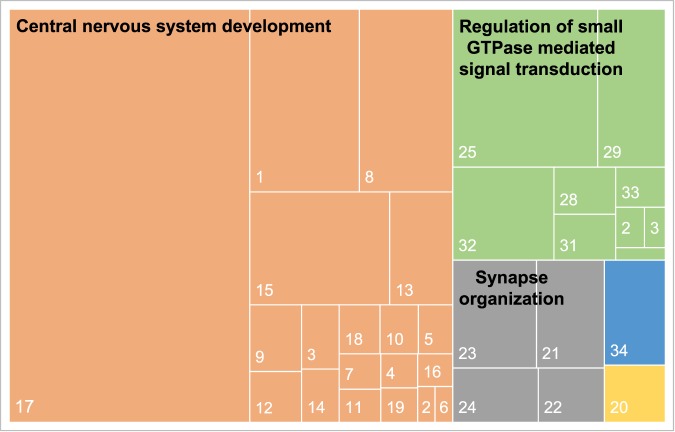
Figure 3.
TreeMap visualization of biological process GO terms (small rectangles) up-regulated. In REVIGO. Superclusters of loosely related terms are visualized using different colors. The size of each rectangle reflects the p-value of the GO term. Where 1. Central nervous system development; 2. Regulation of neuron migration; 3. Neuromuscular process; 4. Neuromuscular process controlling balance; 5. Nerve development; 6. Embryonic camera-type eye morphogenesis; 7. Glomerulus development; 8. Post-embryonic development; 9. Gland morphogenesis; 10. Artery development; 11. Neuroepithelial cell differentiation; 12. Embryonic pattern specification; 13. Developmental growth involved in morphogenesis; 14. Neural tube closure; 15. Head development; 16. Cranial nerve development; 17. Cell morphogenesis; 18. Peripheral nervous system development; 19. Autonomic nervous system development; 20. Neural precursor cell proliferation; 21. Synapse organization; 22. Regulation of synapse structure or activity; 23. Plasma membrane organization; 24. Regulation of cell size; 25. Regulation of small GTPase mediated signal transduction; 26. Positive regulation of JUN kinase activity; 27. Negative chemotaxis; 28.Posttranscriptional gene silencing by RNA; 29. Steroid hormone mediated signaling pathway; 30. Regulation of glutamate receptor signaling pathway; 31. Regulation of synaptic plasticity; 32. Negative regulation of translation; 33. Semaphorin-plexin signaling pathway; 34. Locomotory behavior.

