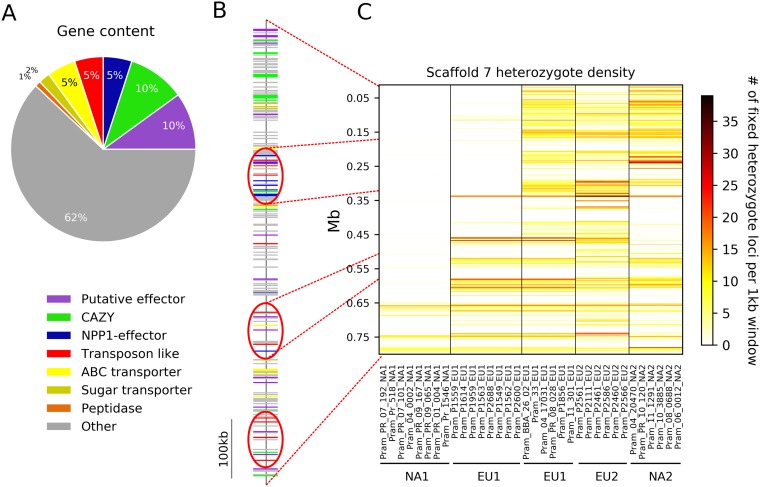
FIG 3.
Comparison of heterozygote density, gene content, and gene location in scaffold 7 of Phytophthora ramorum. (A) Pie chart showing the percentage of each category of putative plant pathogenicity genes out of all genes on scaffold 7. (B) Gene map showing approximate location of genes on scaffold 7. Clusters of effectors, pathogenicity-related genes, and transposons are circled in red. (C) Heterozygote density of representative isolates of each lineage. The run of homozygosity (ROH) pattern displayed for the NA1 lineage is observed in all 38 NA1 isolates. EU1 isolates possessed two distinct patterns on scaffold 7: an ROH pattern shared by eight isolates and a normal pattern in the remaining 38 isolates.

