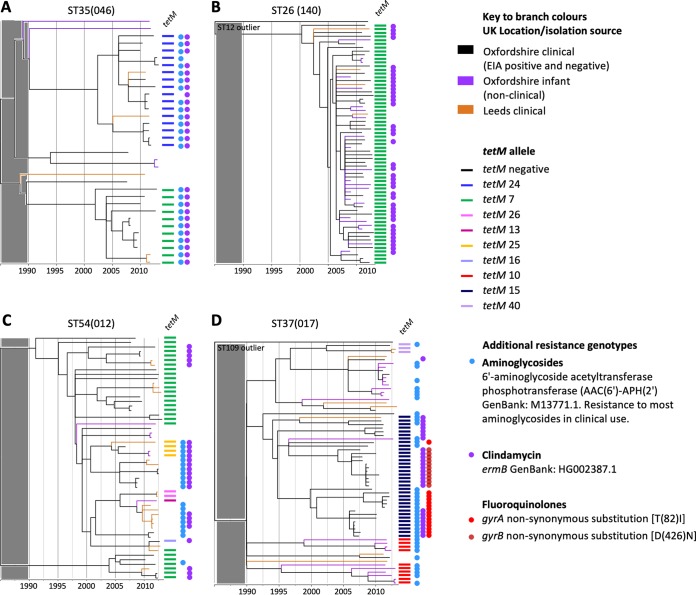
FIG 5.
Phylogenetic analysis of additional tetM-positive C. difficile genotypes. Time-scaled phylogenies were constructed representing four non-RT078 genotypes with >60% tetM prevalence as follows: (A) ST35(046), (B) ST26(140), (C) ST54(012), and (D) ST37(017). In the phylogenies shown in panels B and D, a single closely related genome of a distinct genotype (ST12 and ST109, respectively) was included to ensure that the tree was rooted pre-1990 and that the four phylogenies could therefore be compared post-1990. The gray shaded block over the region corresponding to the period prior to 1990 indicates that the region is not scaled identically for different phylogenies and should not be used for comparisons. Genomes were from Oxfordshire (clinical EIA positives and negatives plus nonclinical, healthy infants) and Leeds (clinical isolates); branch colors indicate location/isolation source as described above. Colored bars to the right of each phylogeny indicate the presence of tetracycline resistance determinants. Colored dots represent additional genetic determinants identified as conferring resistance to fluoroquinolones, rifampin, clindamycin, and aminoglycosides (Table 1 and 2) and are shown where five or more positive genomes were identified per genotype.

