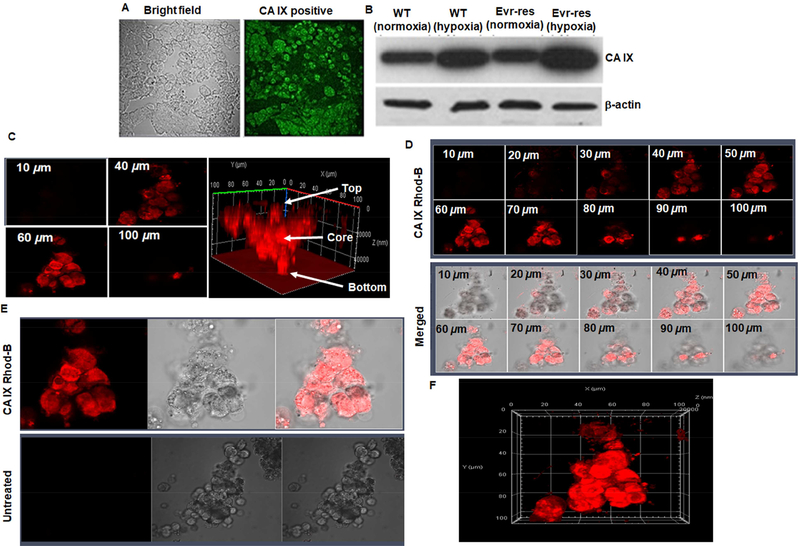
Figure 3. Hypoxia induced CA IX-overexpression in A498 cells and tumors to enable tumor core penetration of CA IX oligomer.
(A) Immunohistochemistry of CA IX-positive A498 RCC tumor xenografts collected from tumor tissue section is shown. The intense bright green fluorescence indicates the rationale for choosing CA IX as an excellent biomarker for RCC specific payload delivery. (B) Western blot detection of CA IX protein in A498 and EV-A498 RCC cells lysates after normoxia and hypoxia (treated with cobalt chloride for 72 h) are shown. The fold up-regulation of CA IX expression in hypoxic WT and EV-res A498 RCC cells compared to normoxia provides a solid foundation for delivering the payload into oxygen-deprived regions and the hypoxic core of RCC tumor. (C) 3D spheroid uptake studies of hypoxia targeted-oligomer (CA IX Rhod-B). Confocal microscope images of CA IX Rhod-B treated hypoxic A498 spheroid indicates tumor matrix penetration of CA IX-oligomer. The untreated and treated spheres were then photographed as noted in the methods section. Z-stacking of the spheroid clearly indicates that fluorescence intensity is superior in 40–60 μm section (core) as compared to 10 or 100 μm (periphery). The highest fluorescence intensity at the center (as indicated by arrow) of 3D- plot suggests that CA IX-Rhod oligomer is highly efficient to reach deep into the core of the tumor spheroid. (D) Z-stacking of the spheroid at different sections from 10–100μm with CA IX targeted formulations also reveals similar findings as noted for the 40–60 μm that had superior fluorescence intensity. Figure (E) shows the untreated control experiments in comparison with CA IXRhod oligomer and Figure (F) shows the overall shape and morphology of the spheroid along the three dimensional (x, y, and z) axis.

