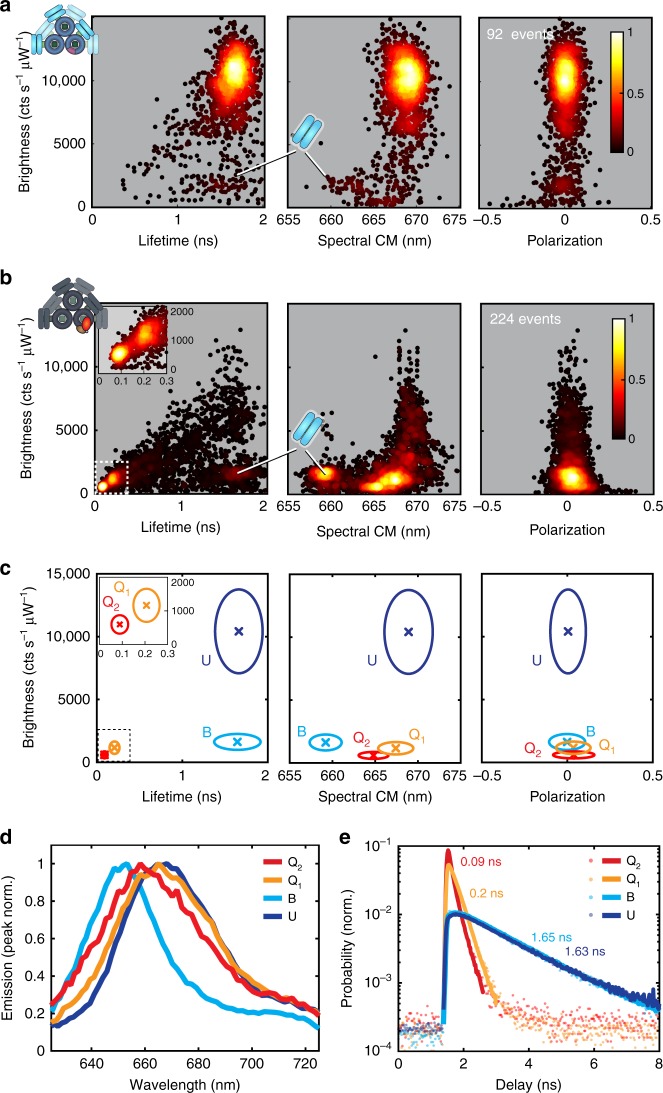
Fig. 3.
Photophysical states of unquenched and OCP-quenched CB-PB Phycobilisomes. a Scatter heatmap of the photophysical state (U) observed for the unquenched CB-PB phycobilisome, shown in Br-τ, Br-λCM, and Br-FPol projections (left, right, and center, respectively). Each point represents 500 photons, colored according to the normalized local density of points for each panel (see colorbar). The location of state B, very rarely observed here, is also indicated for reference. b Scatter heatmap of photophysical states (B, Q1, and Q2) observed for the sample containing OCP-quenched CB-PB phycobilisome, shown in Br-τ, Br-λCM, and Br-FPol projections (left, right, and center, respectively). Each point represents 500 photons, colored according to the normalized local density of points for each panel (see colorbar). c Summary map of observed photophysical states U, B, Q1, and Q2, each depicted by the population mean (x) and 95% confidence ellipse. d Fluorescence emission spectra associated with each photophysical state. e Collective fluorescence lifetime decay and single-exponential maximum likelihood fit for each photophysical state

