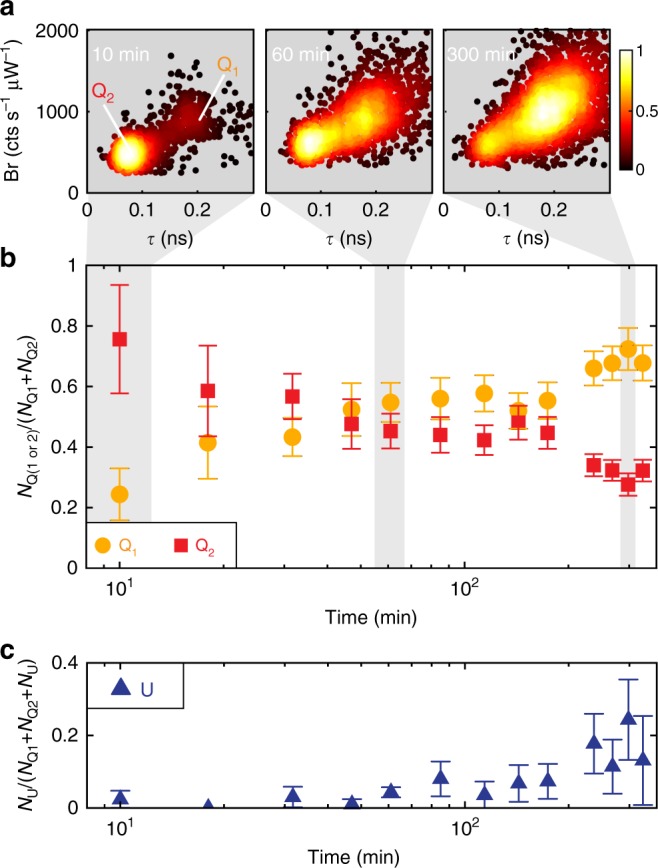
Fig. 4.

Change in relative Q1, Q2, and U populations over time. a Scatter heatmaps of brightness vs. fluorescence lifetime taken 10 min (left), 60 min (center), and 300 min (right) after sample dilution to 10 pM. Each point represents 200 photons, colored according to the normalized local density of points for each panel (see colorbar). b Relative fraction of Q1 (orange) and Q2 (red) trapping events as a function of experiment time from 10 min up to 5 h after sample dilution to 10 pM of CB-PB. Points highlighted in gray are associated with the corresponding scatter heatmaps shown in a. c Relative fraction of unquenched (state U) trapping events observed as a function of time from 10 min up to 5 h after sample dilution to 10 pM of CB-PB. Error bars in b and c represent standard deviations as calculated by error propagation
