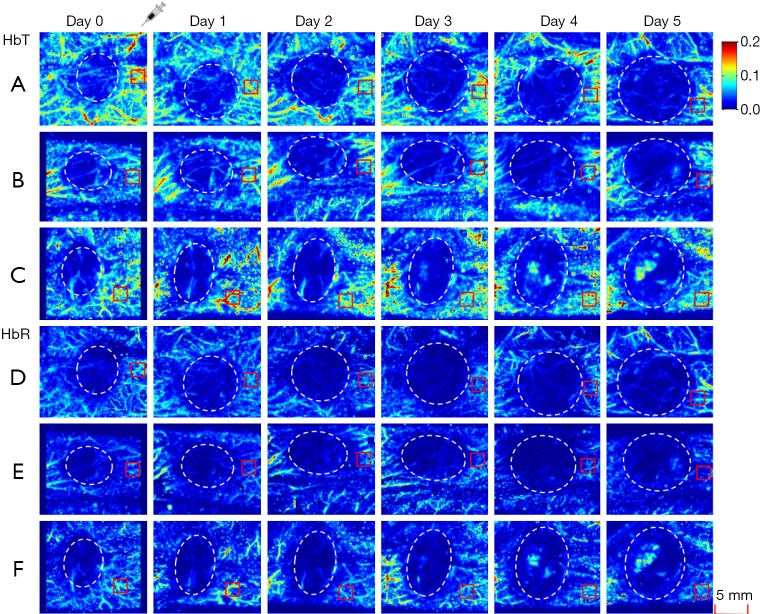
Figure 1.
PAI MAP images from day 0 to day 5. (A,B,C) show maps of HbT. d-f show maps of HbR. The red areas represent ROIs. The white broken circles represent the tumor center. (A) and (D) represent the high-dose groups; (B) and (E) represent the low-dose groups; and (C) and (F) represent the control groups. The units of HbT and HbR are intensity arbitrary.

