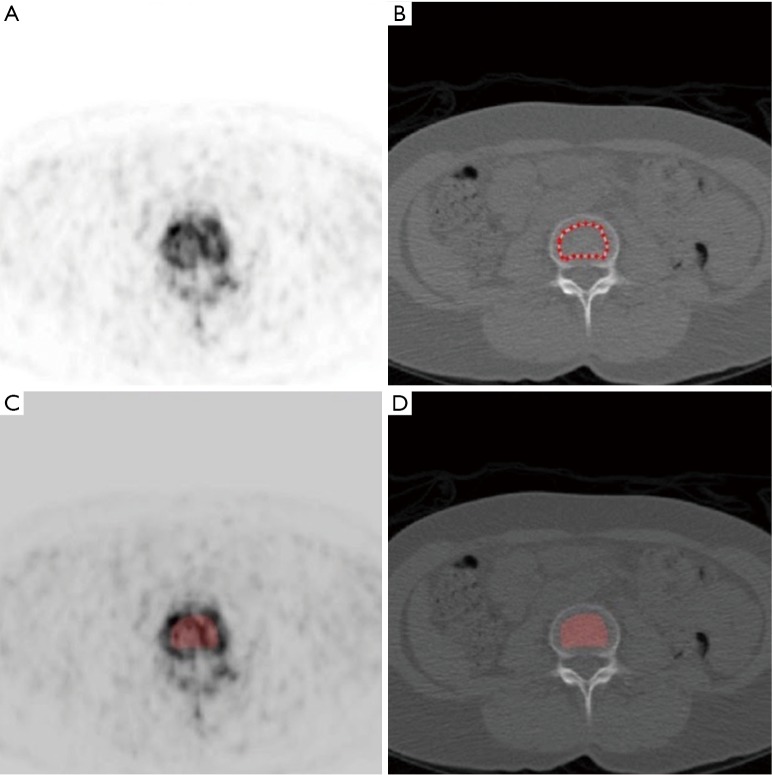
Figure 1.
Representative images illustrating the method of scan analysis. (A,B) Matching [18F]NaF PET and CT images showing the placement of the region of interest (ROI) within trabecular bone in a lumbar vertebra using the CT image; (C,D) the red shaded areas show the ROI in (B) superimposed on the PET and CT images.

