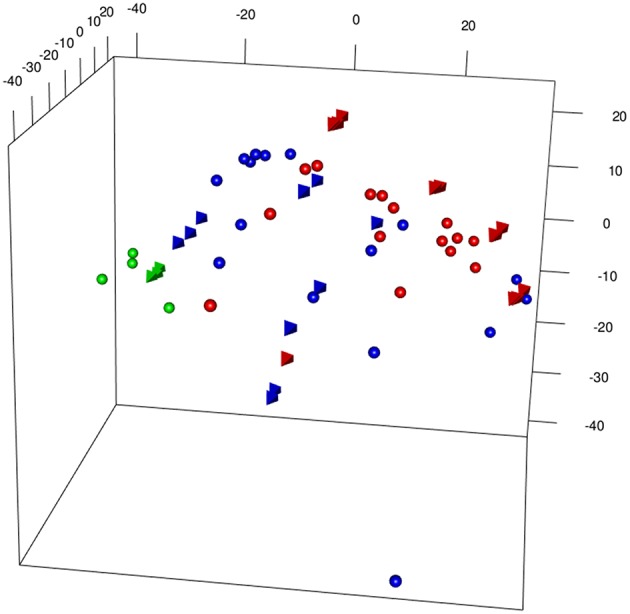
Figure 3.

3DPCA of merged samples from Inflating and Exhausted models' data sets following batch effects removal between different microarray platforms (spheres: Affymetrix, Exhaustion study, tetrahedron: Illumina, Inflation study). The plot is showing overall distribution of Naive (green), Non-Inflating and Non-exhausting (blue), and Inflating and Exhausting (red) samples using the total common set of expressed genes (~14,000).
