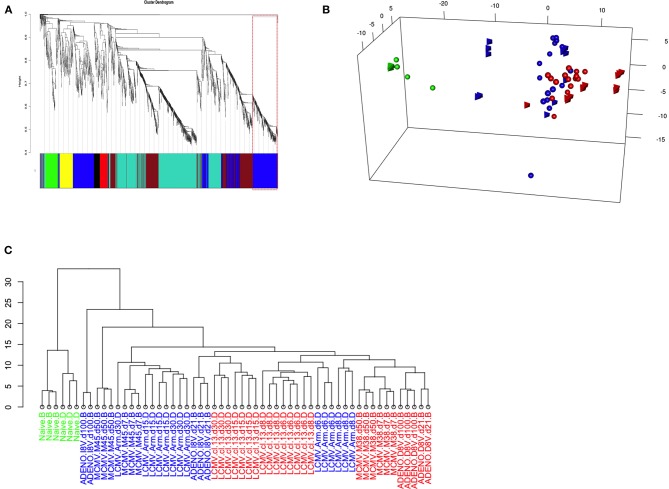
Figure 4.
(A) Weighted Gene Co-expression Network Analysis of Inflating samples. Gene co-expression network analysis detected 6 gene modules (merging distance = 0.25, soft-thresholding power β = 9); Blue module (highlighted) genes are enriched with immune relevant GO categories (Table S3A) and contains relevant genes such as Tbx21, Eomes, Zeb2, and E2f2 (Table S5A). (B) PCA of Inflating/Exhausted samples based on Blue module genes. PCA plot using the first three principal components and based on a gene set of 588 genes, detected as blue module in Gene co-expression network analysis of Inflating samples only (Figure 3A). The plot shows distribution of Naïve (green), Non-inflating and Non-exhausting (blue), and Inflating and Exhausting (red) samples (spheres: Exhaustion study; tetrahedron: Inflation study). (C) Hierarchical clustering of Inflating/Exhausted samples based on Blue module genes. Dendogram plot showing sample clustering analysis (Euclidian distance) on Inflating-Exhausted merged sets, based on a gene set of 469 genes, detected as blue module in a repeated Gene co-expression network analysis of Inflating samples after removing outliers (Soft-thresholding power β = 20).

