Figure 5.
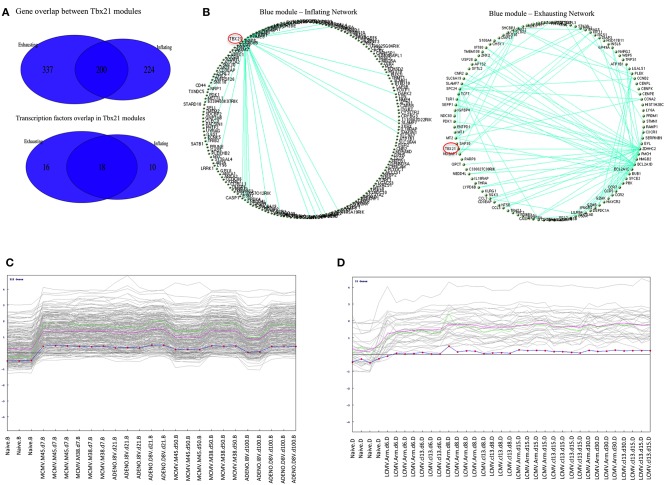
(A) Overlap between Inflation and Exhausted gene modules. Venn diagrams showing gene content overlap between modules containing Tbx21 detected when WGCNA was performed independently on Inflating and Exhausted data sets. (B) Graphical representation of Blue modules networks. Circular topology imposed to blue modules (containing Tbx21) detected in Inflating and Exhausting data sets visualize nodes (genes) with highest connectivity. Only edges with a weight >0.41 (for Inflating) and >54 were plotted. Tbx21 (highlighted in red) is the main hub in Inflating blue module, being the gene with the highest number of connection with other genes. In the Exhausted blue module, although highly expressed, Tbx21 loses the property of being the only hub. (C) Pavlidis Template test in Inflating data Set. Tbx21 used as template for detecting genes with matching expression trajectory across time points. In the Inflating data set 222 genes match the Tbx21 expression pattern (R > 0.8); The green line is the template (Tbx21), the violet line represents average expression, and the dotted line is the centralized (z-score) template expression. (D) Pavlidis Template test in Exhausted data Set. Tbx21 used as template for a method designed to retrieve other genes with a similar expression trajectory across time points. In Exhausting data set 33 genes match Tbx21 expression pattern (R > 0.8); The red line is the template (Tbx21), while the violet line represents average expression, and the dotted line is the centralized (z-score) template expression.

