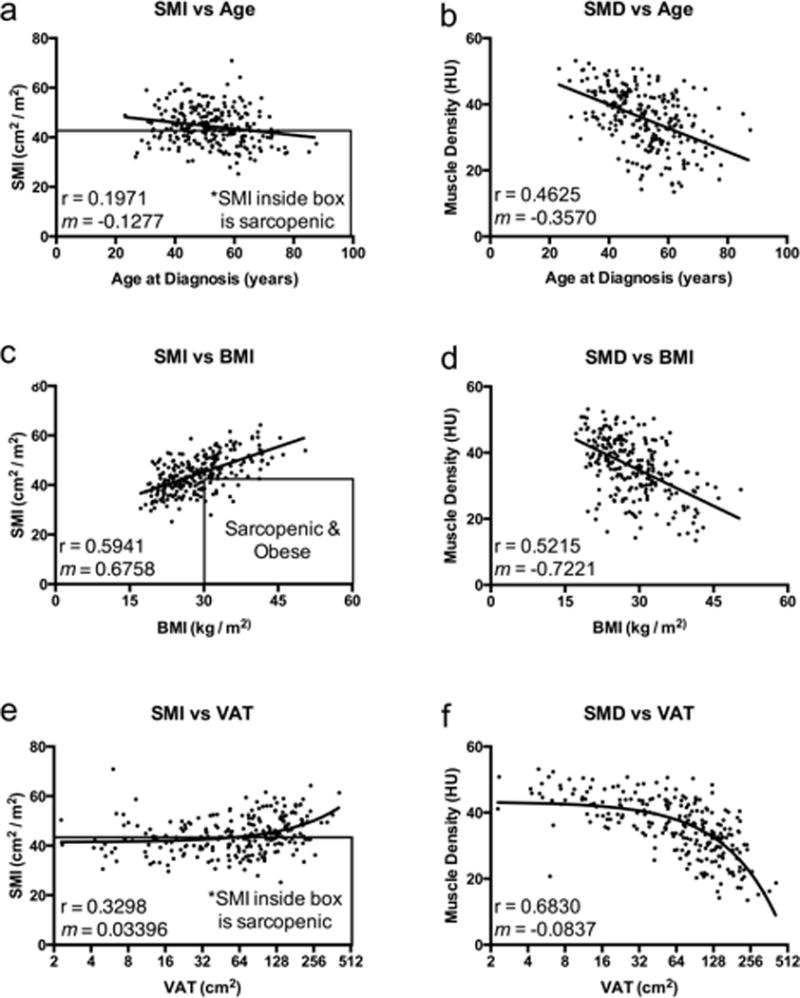
Figure 1. Scatter plots of SMI and SMD.

(A) Skeletal Muscle Index (SMI) versus Age of Diagnosis. (B) Skeletal Muscle Density (SMD) versus Age of Diagnosis. (C) SMI versus Body Mass Index (BMI). (D) SMD versus BMI. (E) SMI versus Visceral Adipose Tissue (VAT). (F) SMD versus VAT. rho and slopes (m) for the correlations are indicated on the individual graphs. VAT values were drawn on a log2 scale based on the wide ranging data stratification, and the best fit line represents a straight line fit.
