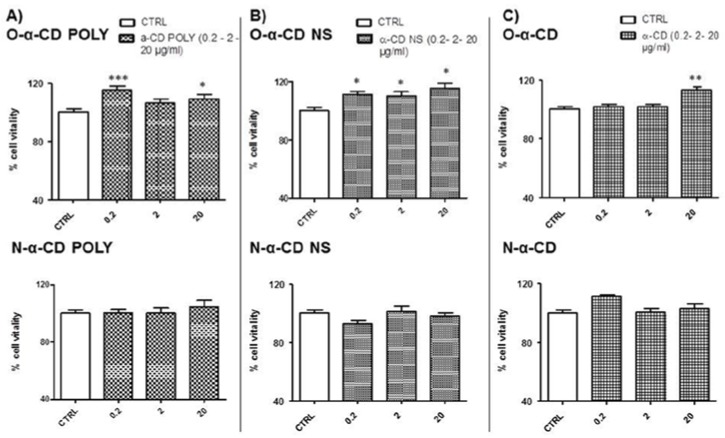
Figure 6.
Dose–response in normoxic conditions. (A) Treatment with O-α-CD POLY (0.2, 2, 20 µg/mL) and N-α-CD POLY (0.2, 2, 20 µg/mL); (B) Treatment with O-α-CD NS (0.2, 2, 20 µg/mL) and N-α-CD NS (0.2, 2, 20 µg/mL); (C) Treatment with O-α-CD (0.2, 2, 20 µg/mL) and N-α-CD (0.2, 2, 20 µg/mL), compared to the untreated control group (CTRL). Data were normalized to the mean value in control conditions and expressed as a percentage.

