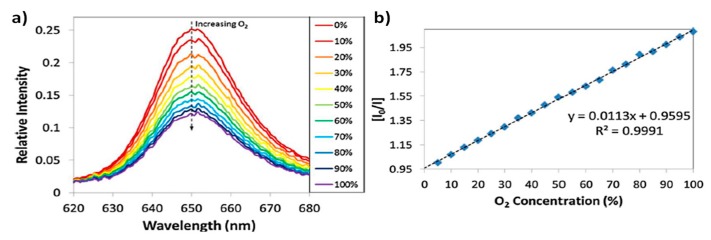
Figure 3.
(a) Luminescence signal from the sensor when it is exposed to different increasing oxygen concentrations; (b) Stern-Volmer plot obtained from the sensor for increasing oxygen 5% steps. Inset the linear approach with the R2 parameter. Reprinted with permission from Ref. [27].

