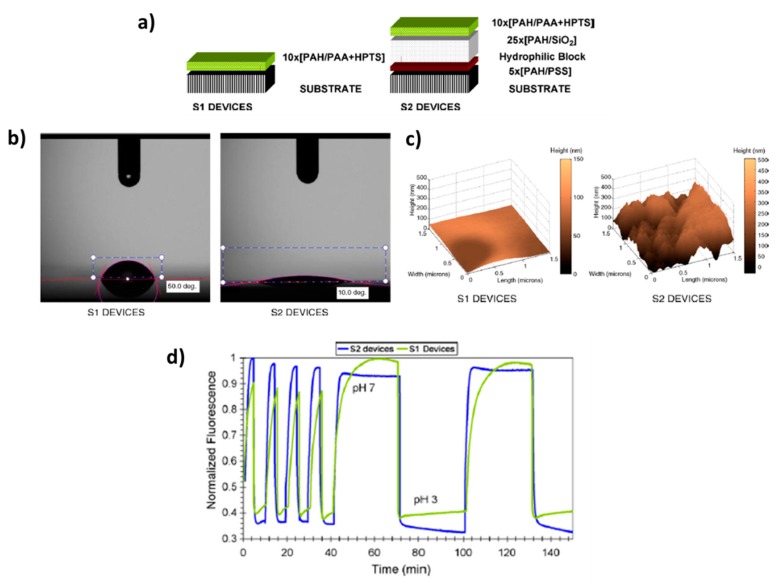
Figure 8.
(a) Schematic representation of both structures (S1 and S2, respectively) for pH sensing; (b) Water contact angle (WCA) measurements and Atomic Force Microscopy (AFM) images (c) for S1 and S2, respectively; (d) normalized fluorescence emission responses of S1 and S2 when they are immersed in pH 3 and 7 buffers for 10 and 30 min of immersion time, respectively. Reprinted with permission of [53].

