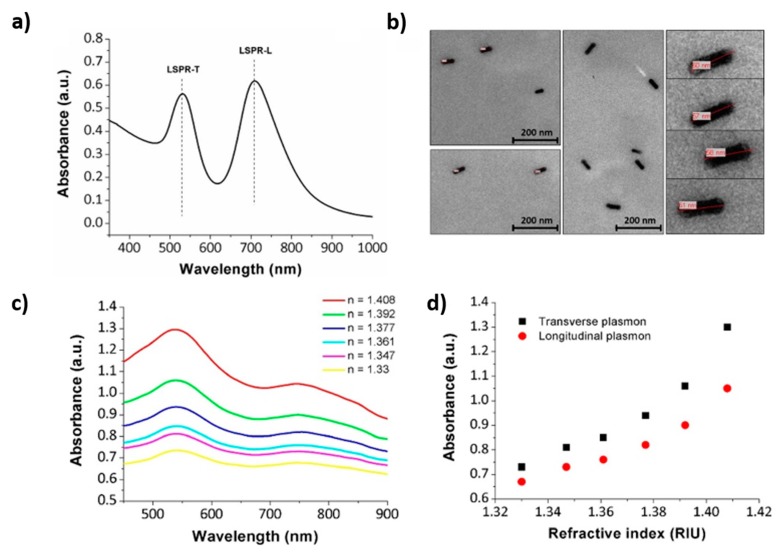
Figure 11.
(a) UV-Vis absorption spectrum of the GNRs@PSS solution with two distinct absorption peaks at 530 nm (LSPR-T) and 710 nm (LSPR-L); (b) TEM micrographs and some zoom details of the synthesized GNRs; (c) Spectral response of the LSPR bands when the sensitive region is immersed in different Refractive Index (RI) solutions; (d) Growth in intensity of the LSPR-T and LSPR-L maxima to external RI variations. Reprinted with permission of [72].

