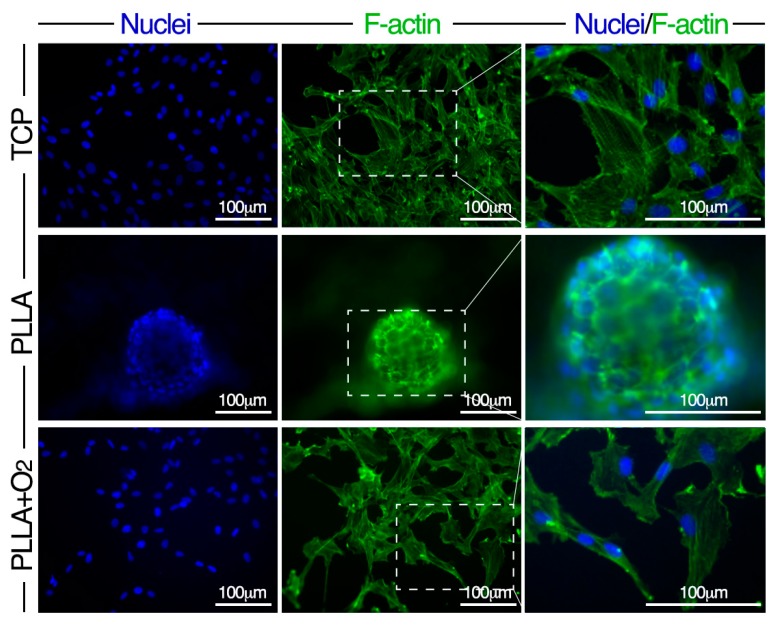
Figure 3.
Morphology of hASCs on PLLA and on PLLA+O2 cultures. Representative fluorescence images of nuclei (DAPI, blue) and F-actin (Phalloidin-FITC, green) in hASCs on TCP, on PLLA, and on PLLA+O2. High magnification of selected dashed squares (merged DAPI-Phalloidin) is reported in the right panel.

