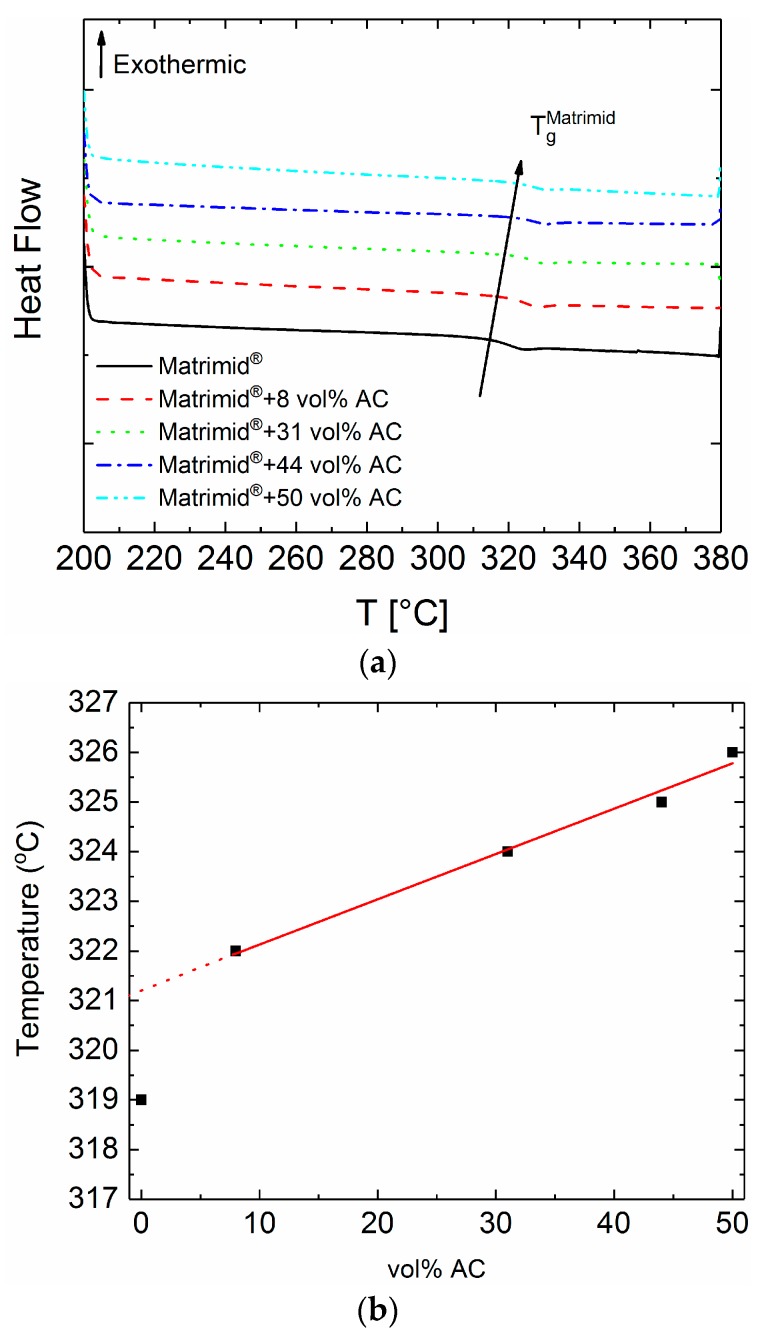
Figure 2.
(a) DSC thermographs for the pure Matrimid® and the Matrimid®–activated carbon (AC) mixed-matrix members (MMMs). The data are vertically shifted for clarity. (b) Glass transition as a function of the AC volume content. The linear fit for the MMMs indicates the slight linear increase of the glass transition due to the well adaption of the AC particles in the polymer matrix.

