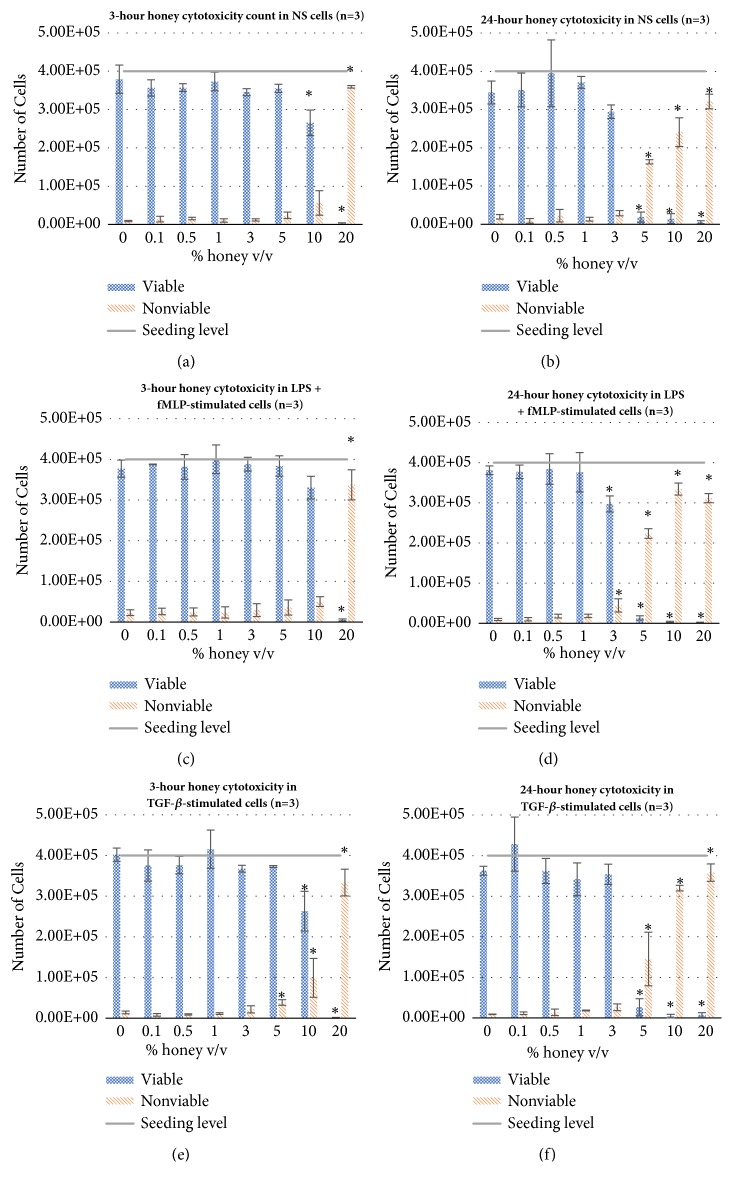
Figure 2.
Viable and nonviable cell counts of NS, LPS + fMLP-stimulated, and TGF-β-stimulated dHL-60s cultured at each honey concentration for 3 (a, c, e) and 24 (b, d, f) hours. ∗ indicates a statically significant difference from the respective 0% honey control of each cell type, viable or nonviable, at each timepoint. α=0.05, measured via one-way ANOVA with Holm-Sidak post hoc.

