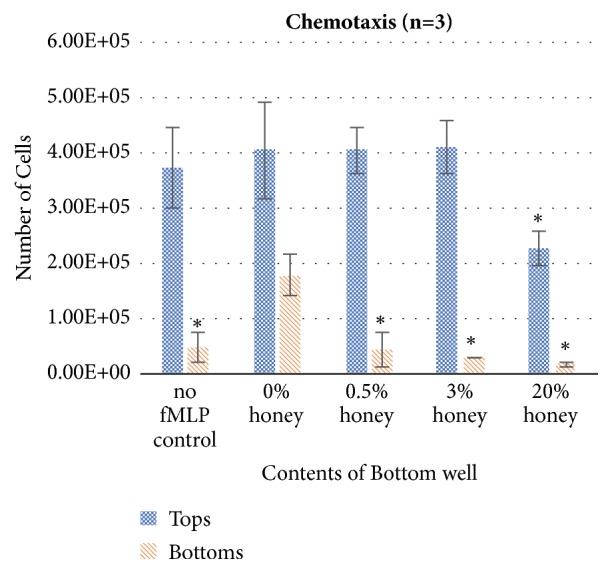
Figure 4.

Chemotaxis of 500,000 dHL-60s to 50 nM fMLP in various concentrations of honey. Cell numbers in top and bottom chambers were measured using a Countess II FL automated cell counter. ∗ indicates a statistically significant difference in cell number from the 0% honey sample. α=0.05, measured via one-way ANOVA with Holm-Sidak post hoc.
