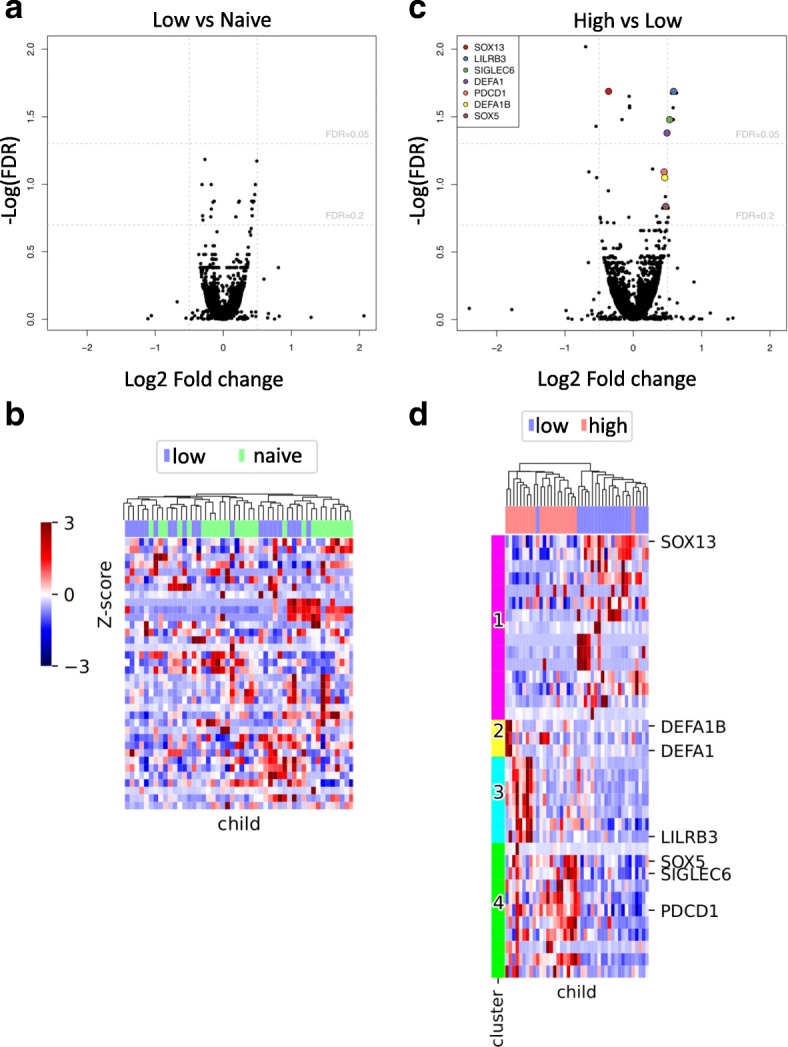
Fig. 1.

Differential gene expression analysis distinguishes blocks of genes separating high- and low-episode groups. a DESeq2 was used to compare the gene expression profiles between naïve and low-episode children. Only small effect sizes were inferred, and most had high FDR values. b Hierarchical clustering of individuals based on differentially expressed genes also did not separate individuals into distinct epidemiological groups. c Differential gene expression analysis between high- and low-episode children reveals subtle but detectable differences including a number of genes with low FDR and known immunological relevant function (highlighted). d We selected 36 gene isoforms with adjusted p values < 0.2 as determined by differential gene expression analysis (DESeq2) between low- and high-episode children. We used hierarchical clustering to order children but used k-means clustering to identify 4 subsets of gene expression patterns. Child episode category (high/low) are shown for comparison with gene profiles
