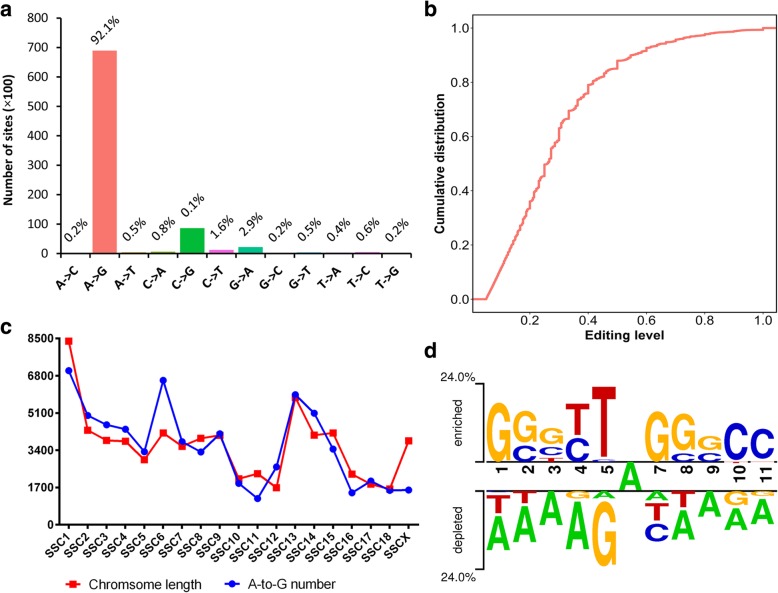
Fig. 2.
Characteristics of the pig editome. a Distribution of RNA editing types. b Cumulative percentage distribution of the editing levels of A-to-G sites. The editing level of a given editing site is determined by the number of reads with the edited base divided by the total reads. If the same site was detected in multiple samples, the highest editing level was used in the analysis. c Chromosome distribution of A-to-G sites. Chromosome length was normalized by multiplying by the number of editing sites/the total length of chromosomes. d Sequence preference of A-to-G RNA editing sites. The enriched (above the top line) and depleted (below the bottom line) nucleotides near the focal editing sites are displayed in Two-Sample Logo. The height of the letters depicts the level of preference/depletion

