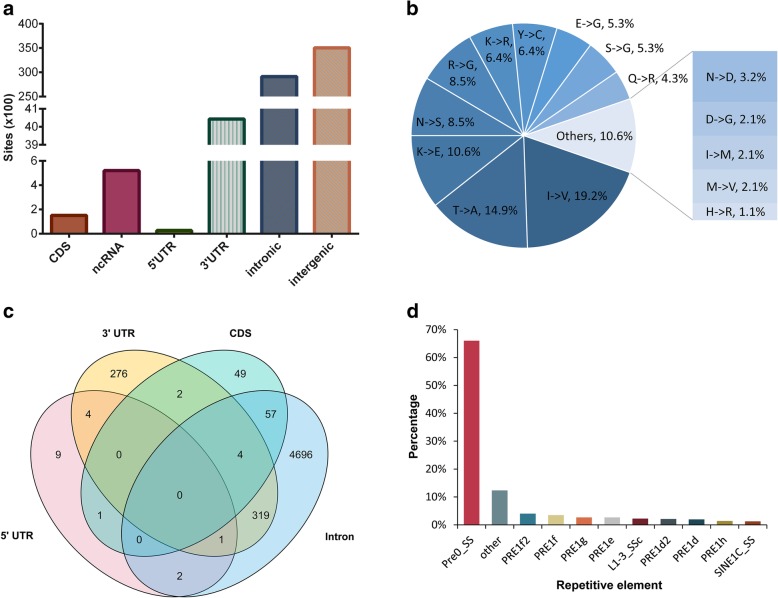
Fig. 3.
Signatures of editing sites in different genomic regions. a Statistics of A-to-G sites in different regions of genes. b Distribution of amino acid changes caused by missense editing. c Venn diagram displaying the distribution of A-to-G sites at the gene level. Most protein-coding genes undergo A-to-G editing in introns. d Distribution of A-to-G sites across repetitive elements. Approximately 66% of repetitive A-to-G sites fall to the Pre0_SS element, which is an active pig-specific SINE belonging to the PRE-1 family

