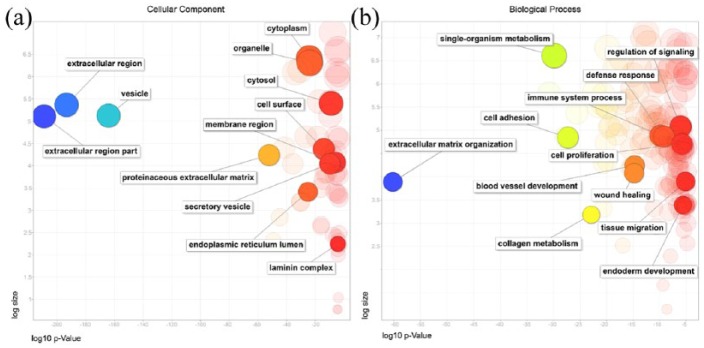
Figure 1.
Gene ontology (GO) analysis of (a) cellular components and (b) biological processes based on the proteins identified in the SD-MSC secretome. A REVIGO scatterplot shows representative clusters of the GO analysis performed with g:Profiler. The log10 p-value of each GO term after REVIGO analysis is plotted on the x-axis, while the frequency of GO term in the GO Annotation Database is displayed on the y-axis (log size). Bubble colors indicate log10 p-value (from smaller p-values on blue color to highest p-values on red color).

