Figure 4.
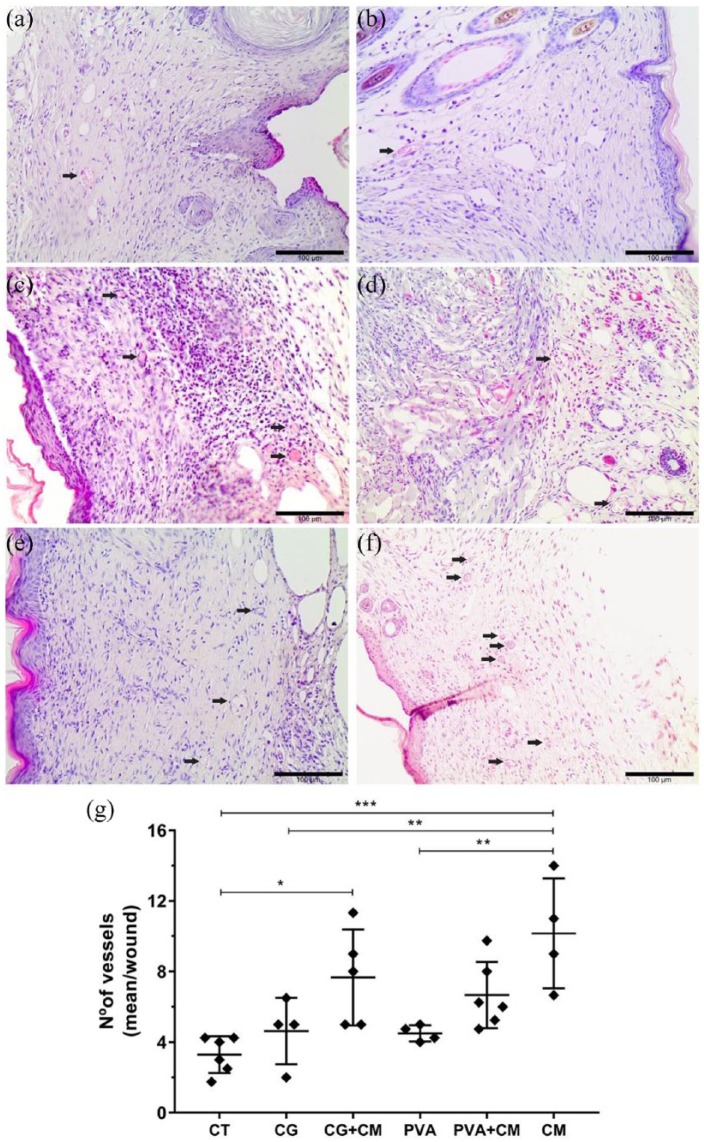
In vivo pro-angiogenic effect of the CM derived from SD-MSCs. Representative H&E-stained images of the granulation tissue showing blood vessels (black arrows—capillaries containing a lumen with red blood cells) in the (a) untreated control group (CT) and treated groups: (b) CG, (c) CG + CM, (d) PVA, (e) PVA + CM, and (f) CM. Scale bars = 100 µm. (g) Graph representing the mean values obtained by counting the blood vessels/wound. *p < 0.05; **p < 0.01; ***p < 0.001.

