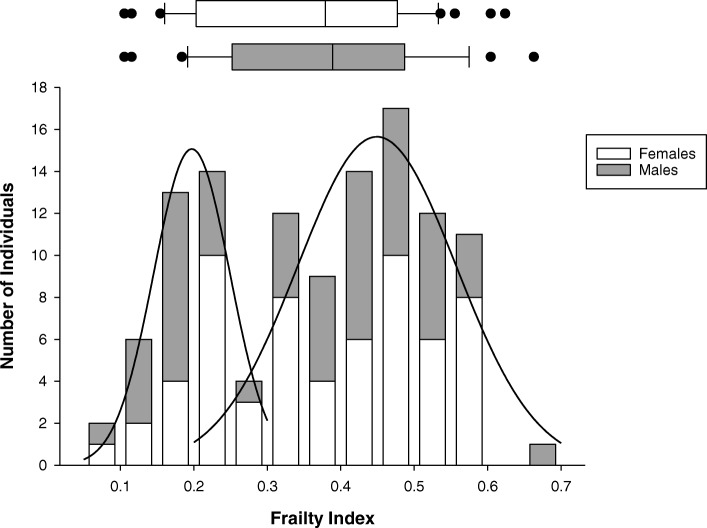
Fig. 1.
Distribution of FI-MDS for the cohort as a whole (n = 116). The density distribution of the FI-MDS was bimodal, with two subgroups of non-frail and frail individuals. The crossing point distinguishing the two sub groups was approximately FI-MDS = 0.27. The horizontal box plots represent the mean FI-MDS in males and females

