
Fig. 2.
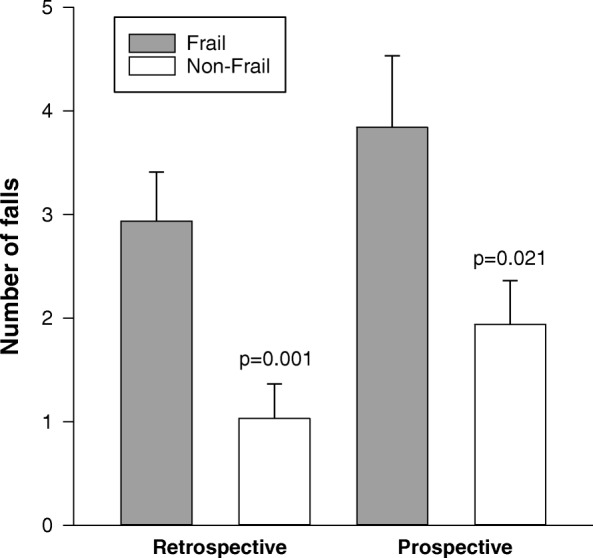
Retrospective and prospective falling rates in individuals who were frail and non-frail (n = 116). Those who were frail had higher retrospective and prospective falling rates (falls/year) than those who were non-frail
Official websites use .gov
A
.gov website belongs to an official
government organization in the United States.
Secure .gov websites use HTTPS
A lock (
) or https:// means you've safely
connected to the .gov website. Share sensitive
information only on official, secure websites.
Retrospective and prospective falling rates in individuals who were frail and non-frail (n = 116). Those who were frail had higher retrospective and prospective falling rates (falls/year) than those who were non-frail