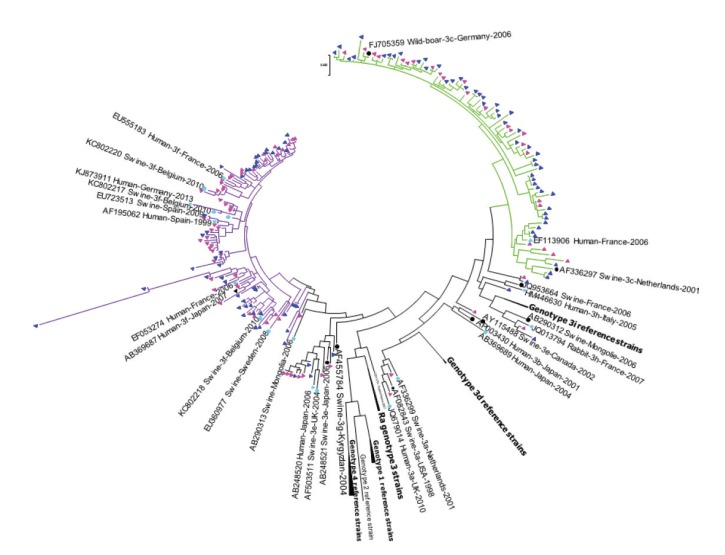
Figure 2.
Phylogenetic analysis of hepatitis E virus genotype 3 isolates, Belgium, 2010–2017 (n = 186 human sequences)
HEV: hepatitis E virus.
Maximum-likelihood phylogenetic tree of a 348 bp fragment from open reading frame 2. Genetic distances were calculated using the Tamura Nei model. GenBank accession numbers are shown for each HEV reference strain used in the phylogenetic analysis and are noted as follows: Accession number_Host-HEV subtype-Country-Year. Triangles represent human HEV sequences and circles animal sequences.
Green lines: all HEV-3c isolates; purple lines: all HEV-3f isolates. Rose symbols: HEV sequences from 2010 to 2015; dark blue symbols: HEV sequences from 2016 to 2017; black symbols: HEV reference strains according to Smith et al. [17]; light blue symbols: other human and animal HEV sequences.

