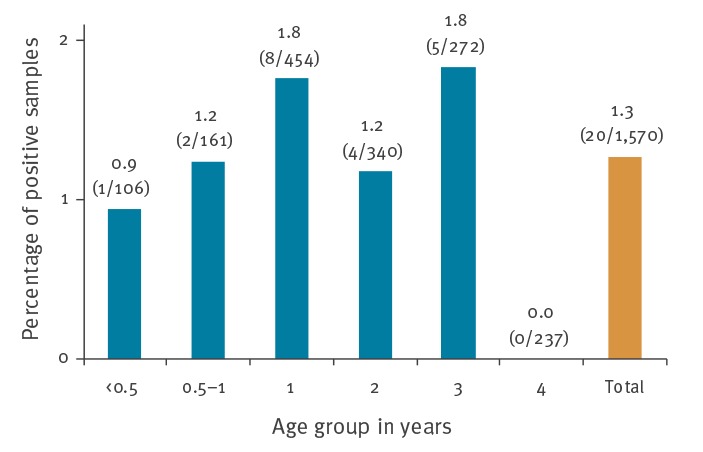
Figure 2.
Influenza C positivity rates in samples in 0–4 year-old children by age group, Germany, 2012–2014 (n = 1,570 samples)a
Percentages as well as total numbers (positive/tested) are depicted above the chart bars.
a A total of 1,588 throat or nasal swabs were considered. Of these, the 1,570 samples that gave a valid quantitative/real-time PCR result are shown in the Figure.

