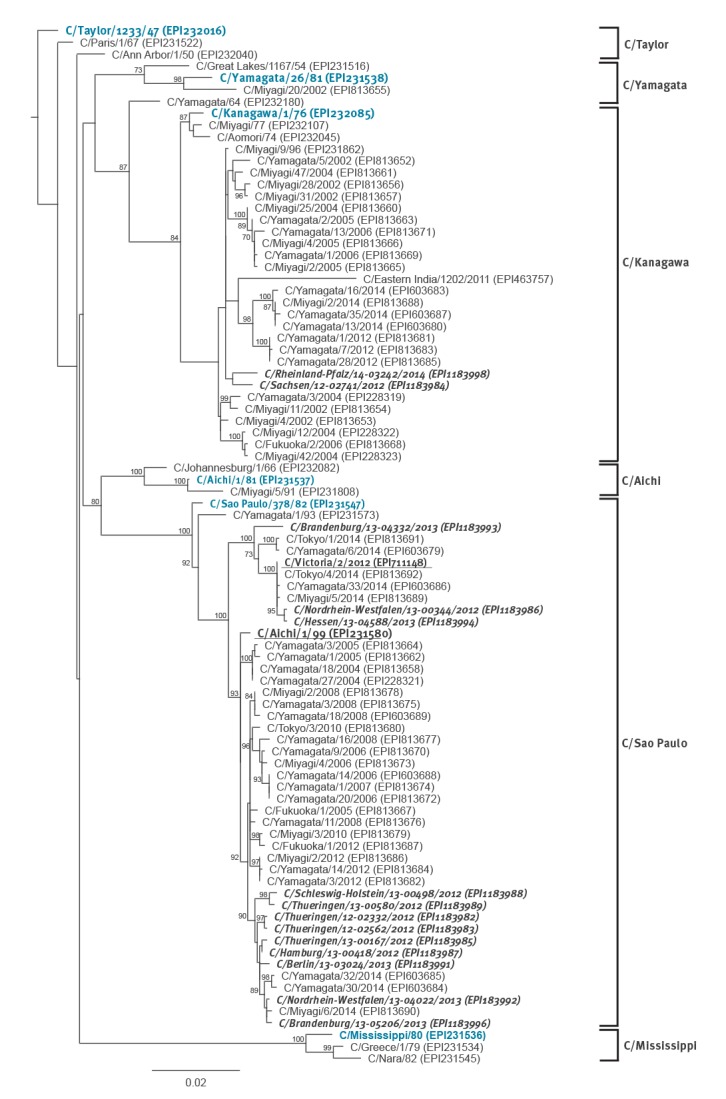
Figure 3.
Phylogenetic analyses of haemagglutinin esterase genetic sequences derived from influenza C-positive samples in 0–4 year-old children using a set of representative sequences from different lineages, Germany, 2012–2014
Bootstrap analyses were performed applying the maximum likelihood algorithm with 1,000 replicates as described in the methods section. The tree is rooted at C/Taylor/1233/47. Only bootstrap values greater than 70 are displayed at the branch nodes. Prototypes of influenza C virus lineages are in bold font and blue colour, subclade representatives are bold and underlined. The German sequences are marked in bold italic letters. The scale indicates the average substitutions per site. Accession numbers of all sequences are provided in brackets.

