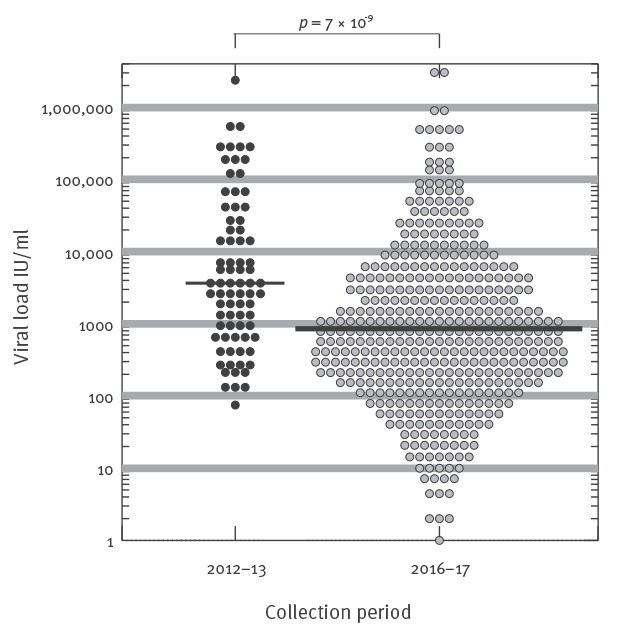
Figure 2.
Hepatitis E virus viral loads in individual blood donors, England, 2012–2013 and 2016–2017 (n = 406)
Geometric mean viral load was significantly higher in the 2012–13 testing period than in 2016–17 (4,740 IU/ml vs 883 IU/ml, p = 7 × 10⁻⁹). Viral load data for 2012–13 has already been published [4].