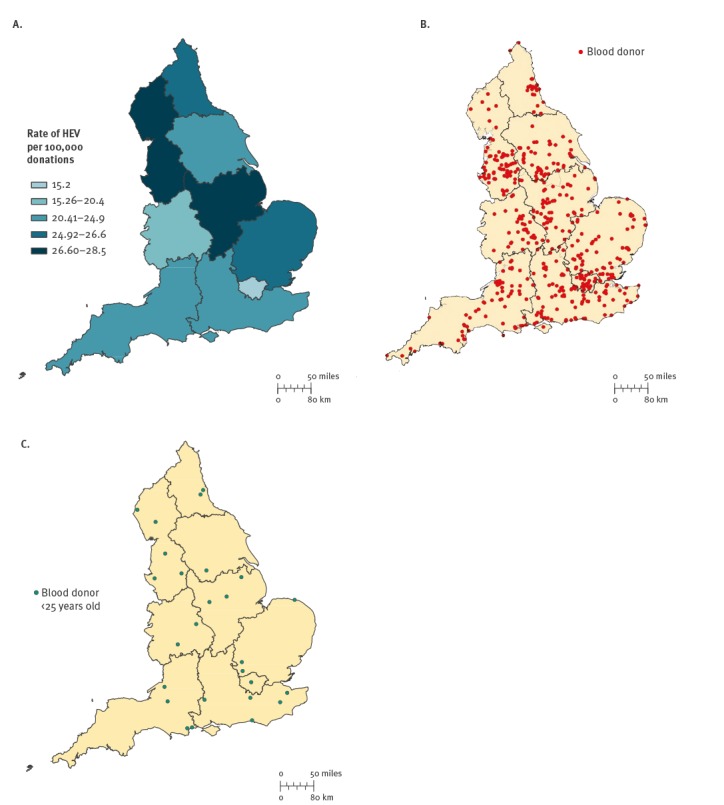
Figure 4.
(A) Hepatitis E virus RNA detection rate per 100,000 blood donations, England, March 2016−December 2017 (n = 480); (B) Geospatial location of hepatitis E virus-infected blood donors, England, March 2016−December 2017 (n = 480) and (C) Geospatial location of hepatitis E virus-infected blood donors under the age of 25 years, England, March 2016−July 2016 (n = 26)
HEV: hepatitis E virus.

