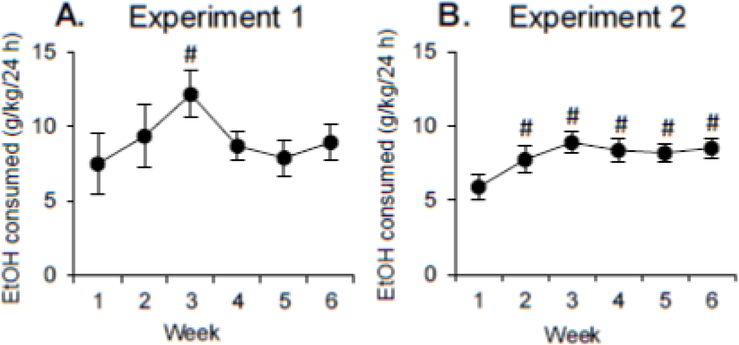
Figure 1. Alcohol consumption.

(A) Alcohol consumption (mean±SEM) in the Alcohol group for the six weeks of CIA access in Experiment 1. (B) Alcohol consumption (mean±SEM) in the Alcohol group for the six weeks of CIA access in Experiment 2. # = significant difference from week 1.
