
Figure 2 ∣. Shared genetic architecture between frequent insomnia symptoms and behavioral and disease traits.
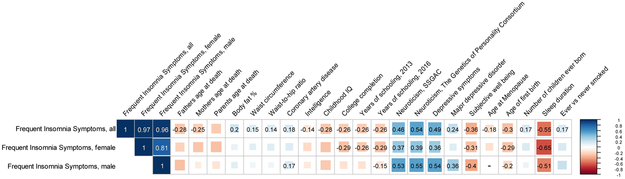
LD-score regression estimates of genetic correlation (rG) of frequent insomnia symptoms are compared with the summary statistics from 224 publicly available genome-wide association studies of psychiatric and metabolic disorders, immune diseases, and other traits of natural variation. Blue, positive genetic correlation; red, negative genetic correlation, rG values displayed for significant correlations. Larger squares correspond to more significant P-values. Genetic correlations that are significantly different from zero after Bonferroni correction are shown on the plot (after Bonferroni correction, P-value cut-off is 0.0002). All genetic correlations in this report can be found in tabular form in Supplementary Table 19. IQ, intelligence quotient.