
Figure 3 ∣. Causal relationships of insomnia symptoms.
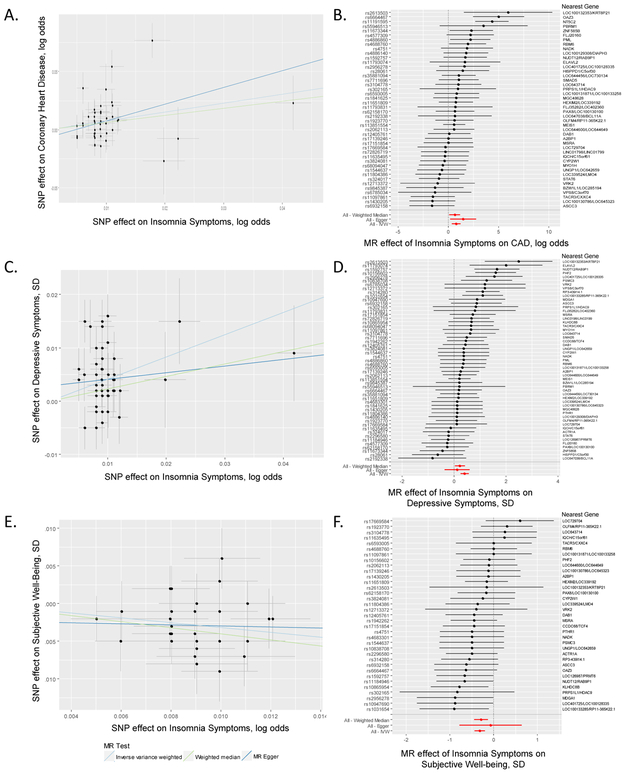
a-f, Association between single nucleotide polymorphisms associated with frequent insomnia symptoms and CAD (a), subjective well-being (c), and depressive symptoms (e). Per allele associations with risk plotted against per allele associations with frequent insomnia symptom risk (vertical and horizontal black lines around points show 95% confidence interval for each polymorphism) results are shown for three different MR association tests. Forest plots show the estimate of the effect of genetically increased insomnia risk on CAD (b), depressive symptoms (d), and subjective well-being (f) as assessed for each SNP. Nearest gene(s) is displayed to the right of plot. Also shown for each SNP is the 95% confidence interval (gray line segment) of the estimate and the Inverse Variance MR, MR-Egger, and Weighted Median MR results in red. Sample size of each GWAS used in the MR analyses is as follows: frequent insomnia symptoms (ncases = 129,270, ncontrols = 108,352), CAD (ncases = 60,801, ncontrols = 123,504), subjective well-being (n = 298,420), and depressive symptoms (n = 161,460).