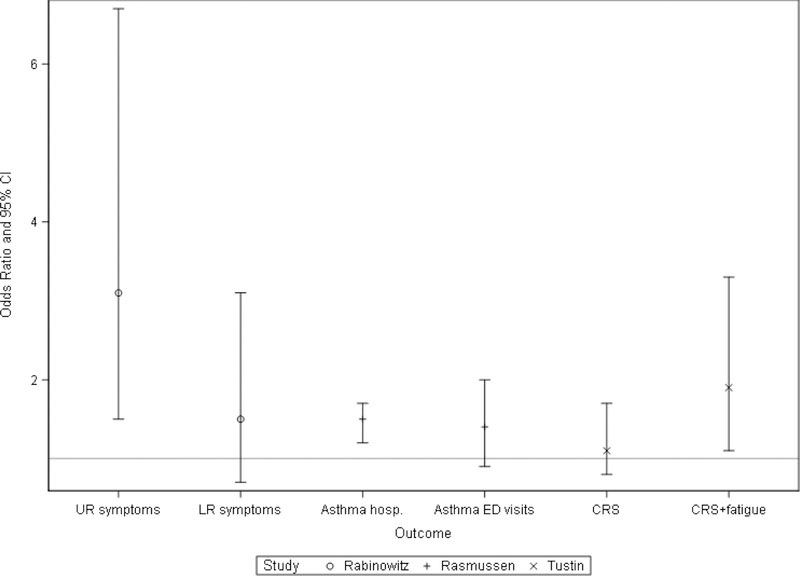
Figure 1.
Select adjusted odds ratios (OR) and 95% confidence intervals (CI) from studies examining respiratory symptoms or outcomes and proximity to unconventional natural gas development. ORs reported for the most vs. least exposed groups from each study. (Abbreviations: UR=upper respiratory, LR=lower respiratory, hosp.=hospitalizations, ED=emergency department, CRS=chronic rhinosinusitis)

