
Figure 1b.
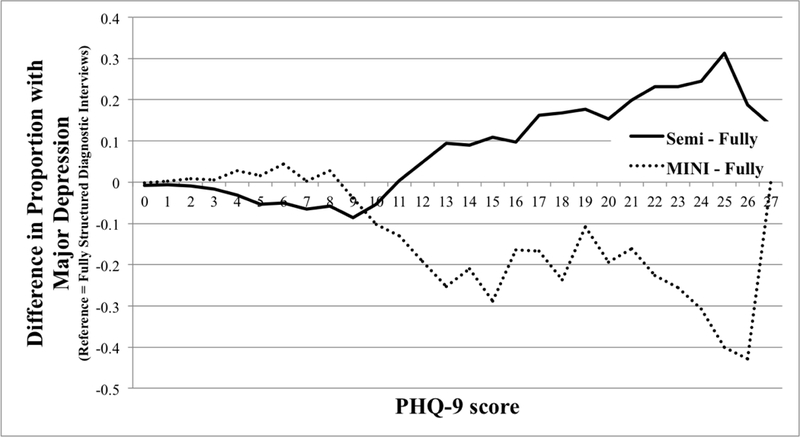
Difference in Probability of Major Depression Classification by PHQ-9 Score for Semi-structured Interviews and MINI compared to Fully structured Interviews (Excluding MINI).
Differences in proportions are plotted as 3-point moving averages (e.g., the differences in proportions at the PHQ-9 score of 10 are averages of the differences in proportions at PHQ-9 scores of 9, 10, and 11).