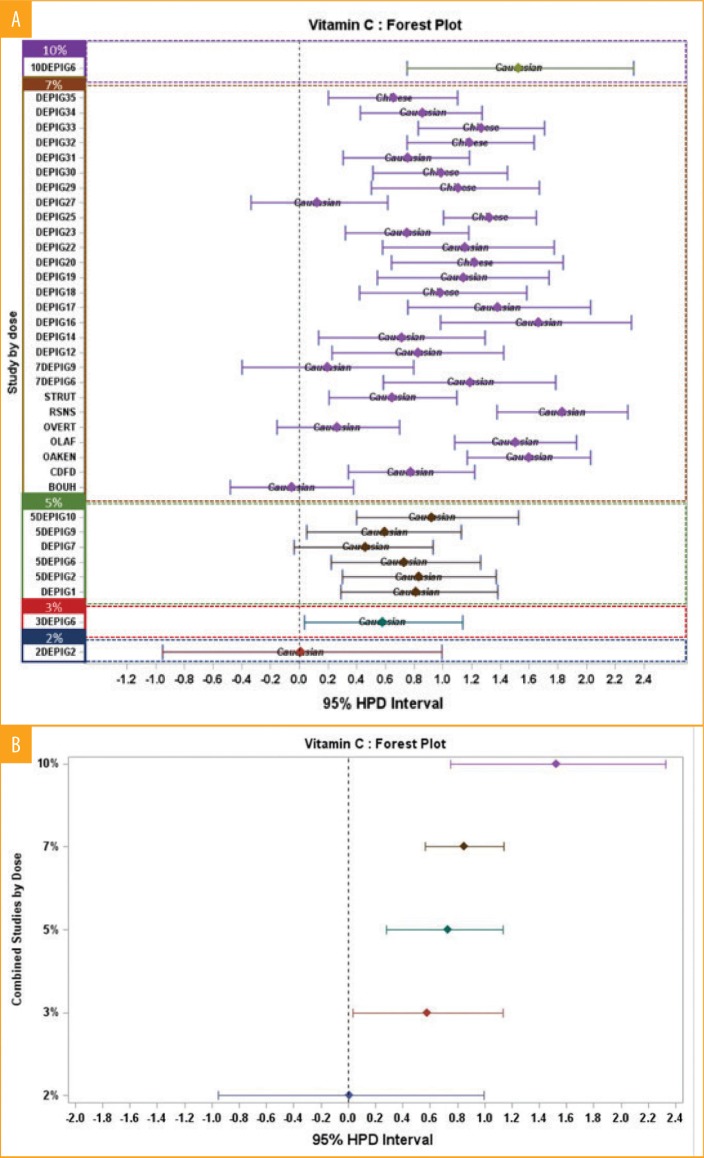
FIGURE 3.
A) Forest plot graphic per studies and concentration with both Caucasian and Chinese populations—As an example, the concentration 7% varies from 0 to 1.6 of Delta E difference; B) Forest plot graphic with mean per concentration with both Caucasian and Chinese populations—As an example, the concentration 7% is globally superior to 0.8%, corresponding to the moderate effect class.

