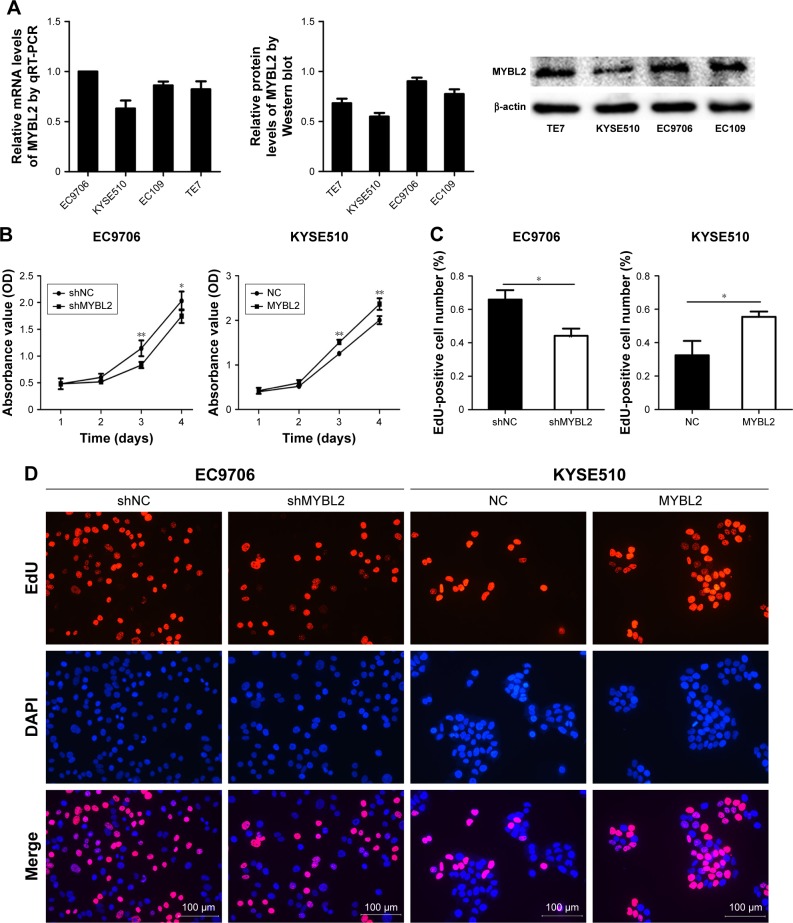
Figure 2.
Effect of MYBL2 expression on the growth and DNA synthesis of ESCC cells.
Notes: (A) MYBL2 mRNA and protein levels were detected by quantitative PCR and Western blotting in ESCC cell lines. (B) Cell-growth rate was measured by CCK8 cell-viability assays at various time points (*P<0.05; **P<0.01). Data presented as means ± SD (n=5). (C, D) EdU retention assay in cells underexpressing (EC9706) or overexpressing (KYSE510) MYBL2. Representative fluorescence images are shown. Numbers of EdU-positive cells depicted in bar chart (*P<0.05). Data presented as means ± SD (n=3).
Abbreviations: ESCC, esophageal squamous-cell carcinoma; EdU, 5-ethynyl-2′-deoxyuridine.

