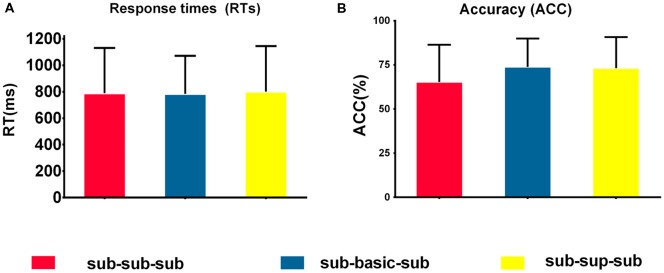
Figure 2.
Behavioral performance. (A) Mean response times (RTs) to target stimuli in the three conditions. There were no significant differences among the sub-sub-sub, sub-basic-sub, sub-sup-sub. p > 0.05 [one-way repeated-measures analysis of variance (ANOVA)]. (B) Accuracies in response to target stimuli in the four conditions. There were no significant differences among the sub-sub-sub, sub-basic-sub, sub-sup-sub. p > 0.05 [one-way repeated-measures analysis of variance (ANOVA)], N = 18. For each condition, error bars represent ±SEM across participants. NB. “RT” is response time; “sub-sub-sub,” “sub-bas-sub,” and “sub-sup-sub” represent subordinate-subordinate-subordinate, subordinate-basic-subordinate, and subordinate-superordinate-subordinate, respectively.

