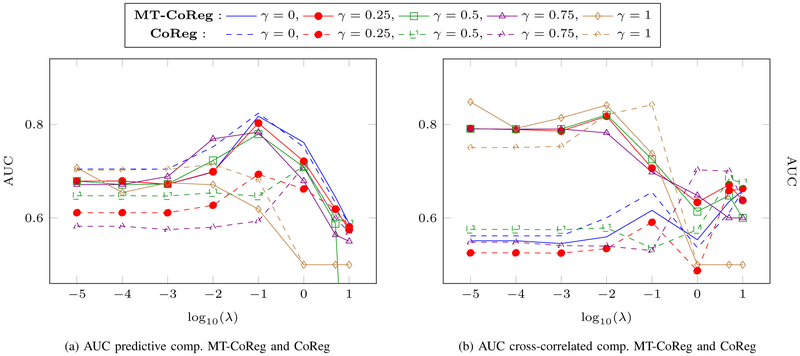
Fig. 3: A comparison between MT-CoReg (solid lines) and CoReg (dashed lines) on a simulated dataset for variable selection.
AUC values for each cross-correlated and predictive components, for various values of the parameter γ are used. (a): AUC value relative to predictive components , for both MT-CoReg and CoReg. (b): AUC value relative to cross-correlated components , for both MT-CoReg and CoReg. We can observe from (a-b) that 0 < γ < 1 produce interesting solutions compared to γ = 0 (standard Lasso) and γ = 1 (sparse CCA). For example, when γ = 0.25, MT-CoReg is able to efficiently select the real non zero features from both predictive and cross-correlated components. Overall, when comparing solid and dashed lines, we can observe that MT-CoReg produces higher AUC values that CoReg.

