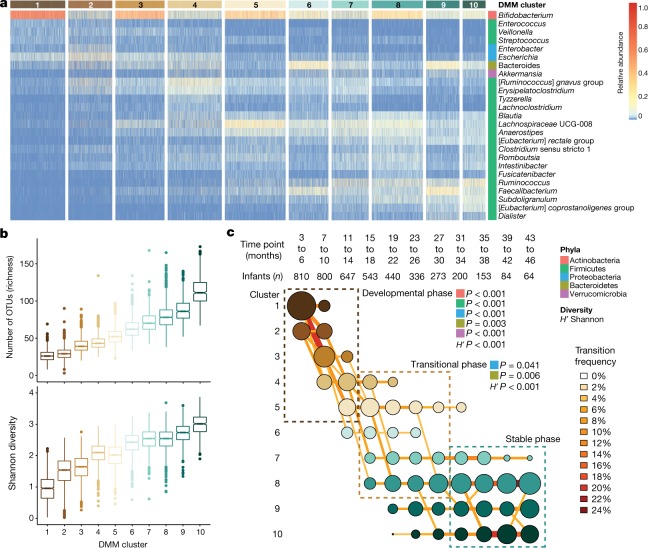
Fig. 1. DMM clustering of 16S rRNA gene sequencing data (n = 12,005).
The entire dataset formed ten distinct clusters based on lowest Laplace approximation. a, Heat map showing the relative abundance of the 25 most dominant bacterial genera per DMM cluster. Taxa names in square brackets are in need of formal taxonomic revision. b, Box plots showing the alpha diversity (richness and Shannon’s diversity) per each DMM cluster. The centre line denotes the median, the boxes cover the 25th and 75th percentiles, and the whiskers extend to the most extreme data point, which is no more than 1.5 times the length of the box away from the box. Points outside the whiskers represent outlier samples. c, Transition model showing the progression of samples through each DMM cluster per each time point, from months 3 to 46 of life. Dashed boxes show the three phases of microbiome progression (developmental, transitional and stable phase). Solid squares next to the labels denote the significant changes in phyla and Shannon’s diversity (H') per phase based on multiple linear regression. All phyla and the H' were significant in the developmental phase, two phyla and the H' were significant in the transitional phase, and no phyla or the H' were in the stable phase. Nodes and edges are sized based on the total counts. Nodes are coloured according to DMM cluster number and edges are coloured by the transition frequency. Transitions with less than 4% frequency are not shown. Results are further supported by the metagenomic sequencing data in Extended Data Fig. 2.

