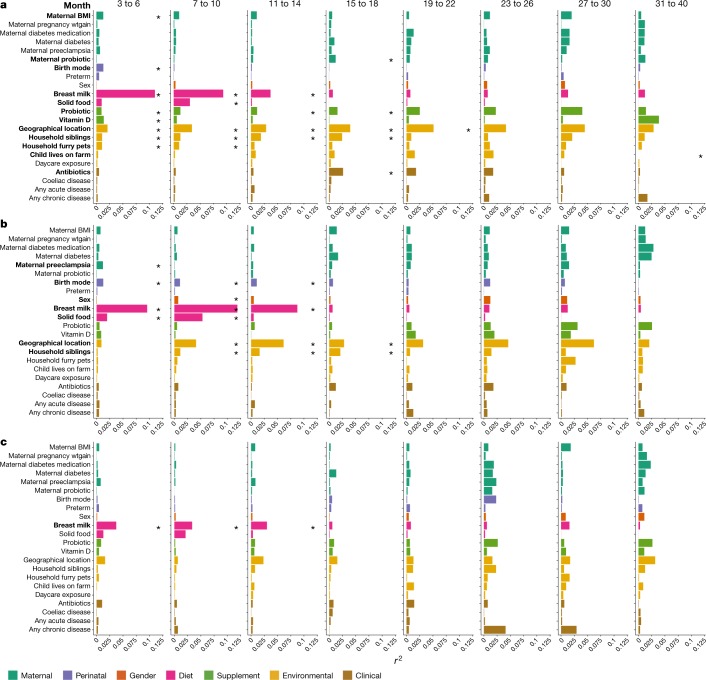
Fig. 2. Significance and explained variance of 22 microbiome covariates modelled by EnvFit across all data types.
Horizontal bars show the amount of variance (r2) explained by each covariate in the model as determined by EnvFit. The groups within each covariate are detailed in Extended Data Table 1. Covariates are coloured based on overall metadata group. Significant covariates (false discovery rate (FDR) P < 0.05) are represented in bold font. Asterisk denotes the significant covariates at each time point. BMI, body mass index; wtgain, weight gain. a, Microbiome profiles at the genus level based on 16S rRNA gene sequencing data (n = 4,069). b, Microbiome profiles at the species level based on metagenomic sequencing (n = 3,843). c, Functional metagenomic capacity at the module level based on metagenomic sequencing (n = 3,843).

