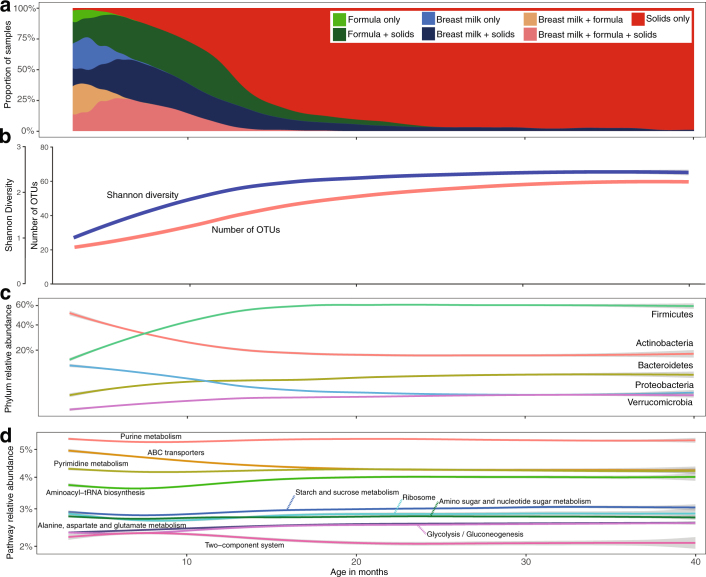
Extended Data Fig. 1. Characterization of the gut microbiome over the first 40 months of life (n = 11,717).
a–d, 16S rRNA gene sequencing (a–c) and metagenomic sequencing (d) analysis. Curves show LOESS fit for the data per category, and shaded areas show permutation-based 95% confidence intervals for the fit. a, Summary of overall dietary status. b, The mean alpha diversity (richness and Shannon diversity) per child increased rapidly from 3 to 20 months of life. c, The mean relative abundance of the five most abundant bacterial phyla show changes from 3 to 20 months of life and generally remain stable after month 30 of life. d, The mean relative abundance of the ten most abundant bacterial pathways shows relative stability, with ABC transporters and two-component system showing the largest reduction from 3 to 20 months of life.

