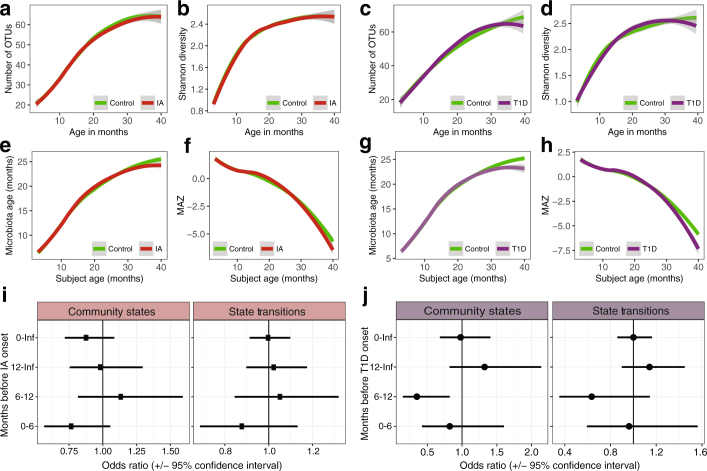
Extended Data Fig. 4. The microbiota was not associated with the development of persistent IA and T1D.
Data are based on 16S rRNA gene sequencing (n = 11,717). Analysis based on a nested 1:1 case–control cohort of equal samples. Curves show LOESS fit for the data per category, and shaded areas show permutation-based 95% confidence intervals for the fit. a, b, The number of OTUs (a) and the Shannon’s diversity index (b) in the IA cohort. c, d, The number of OTUs (c) and Shannon’s diversity (d) in the T1D cohort. e, f, Microbiota age (e) and MAZ score (f) in the IA cohort. g, h, Microbiota age (g) and MAZ score (h) in the T1D cohort. i, j, Forest plot showing the odds ratios for the association between the microbiome stability metrics and development of IA (i) and T1D (j). A separate conditional logistic regression was run for four time intervals: (1) birth to onset; (2) 12 months before onset; (3) 6–12 months before onset; and (4) 6 months before onset. Models were adjusted for HLA genotype, mode of delivery, duration of exclusive breastfeeding, number of antibiotic courses, and number of infectious episodes. Community states are the total number of unique clusters exhibited by an infant and state transitions are the number of transitions between clusters. No odds ratio was significantly different between cases and controls (Supplementary Table 3).

