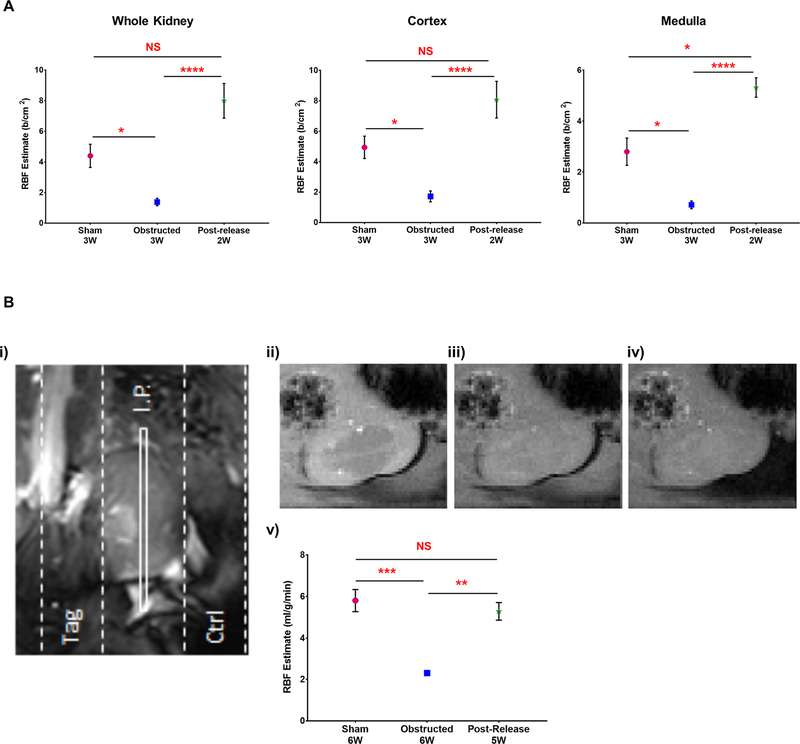
Figure 5. RBF improves significantly following the release of obstruction:
(A) RBF estimation using contrast-enhanced ultrasonography showed a significant reduction in 3W obstructed kidneys (n=3) compared to 3W sham-operated kidneys (n=3). Release of obstruction resulted in significant recovery in the RBF at 2-weeks post-release (n=5) in the whole kidney, cortex and medulla (B) RBF estimate by spASL-MRI performed in 6W old animals (i) MRI schematic of the spASL pulse sequence on left kidney showing the slab positions of the imaging plane (I.P.) and two saturation bands: tag and control (ctrl). The tag saturation band labels incoming renal blood by placing an inversion pulse over the renal artery, and the control uses an inversion pulse symmetric to the imaging plane (ii-iv) Representative magnitude images of left kidney without saturation pulses, after the control saturation pulse and after the tag saturation pulse (v) RBF estimation by spASL-MRI revealed a significant reduction in cortical RBF rate in 6W obstructed kidneys (n=3) in comparison to similar age group of sham-operated kidneys (n=5). Release of obstruction (n=7) resulted in a significant recovery in RBF (*P<0.05; **P<0.01; ***P<0.001; ****P<0.0001; NS-non significant)

