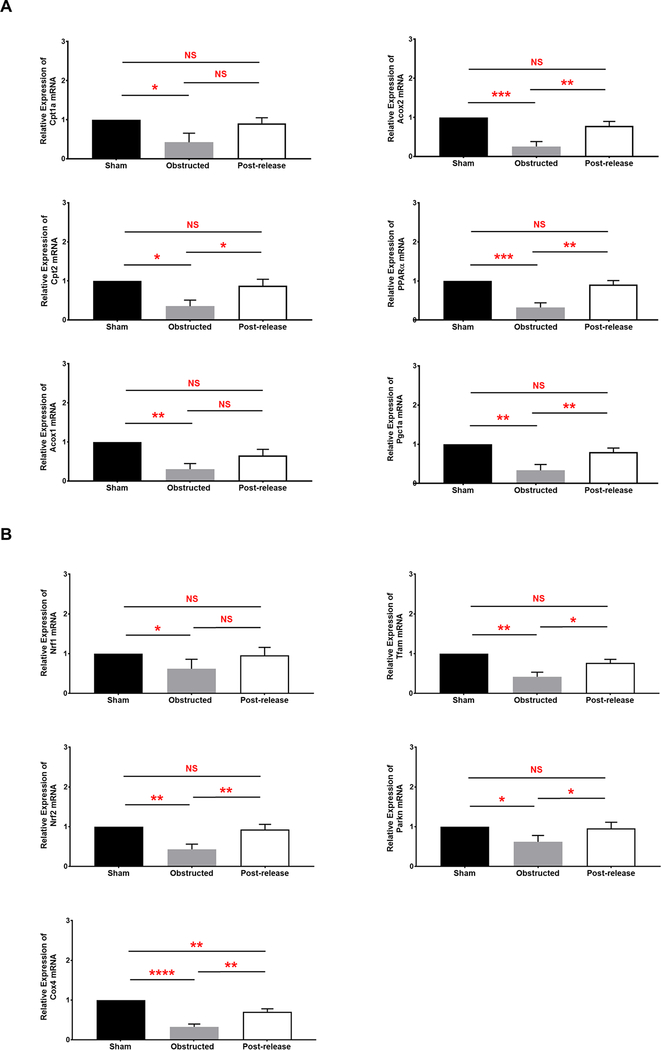
Figure 8. Differential regulation fatty acid metabolism and mitochondrial dysfunction during obstruction damage and recovery by qRT-PCR:
(A) Relative mRNA transcript levels of genes and transcriptional regulators of fatty acid metabolism in 3W sham (n=4), obstructed (n=5) and released kidneys (n=6) at 2W post-release (B) Relative mRNA transcript levels of mitochondrial specific genes in 3W sham (n=4), obstructed (n=5) and released kidneys (n=6) at 2W post-release (*P<0.05; **P<0.01; ***P<0.001; ****P<0.0001; NS-non significant).

