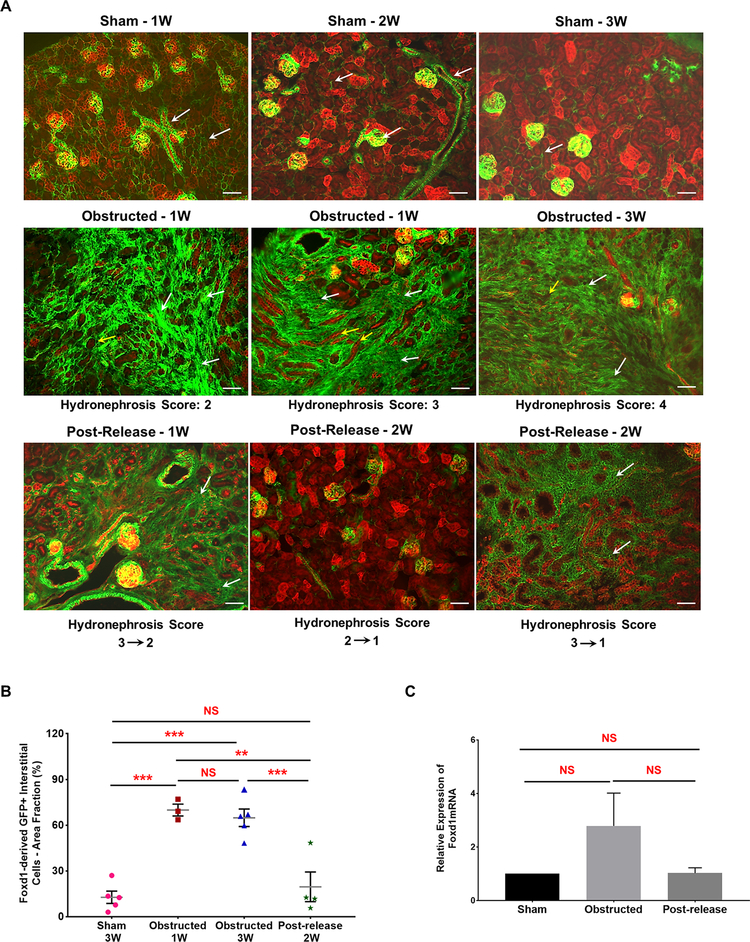
Figure 9. Foxd1-derived GFP+ interstitial pericytes expand during pUUO damage:
(A) Kidneys from Foxd1Cre;mTmG mice at different time intervals after obstruction and release of obstruction. Foxd1 lineage (GFP+) cells are observed in smooth muscle cells lining the renal arteries and arterioles, pericytes in the interstitium and in the glomerular mesangium (white arrows in Sham-1, 2 and 3W). The GFP+ Foxd1 lineage cells expanded in the renal interstitium of the obstructed kidneys at 1 week post obstruction (white arrows). In addition, RFP+ tubules in the damaged interstitium exhibited tubular dilation, collapse and loss (yellow arrows). In contrast, the hydronephrosis and interstitial damage decreased post-release. The recovery in GFP+ interstitial cell expansion in released kidneys was in proportion to the hydronephrosis index at the time of release, as kidneys with score 2 recovered completely compared to kidneys with score 3 (white arrows). Scale bars, 50μm. (B) Scatter plot shows mean ± SE of percent GFP+ interstitial cell area fraction of left kidneys subjected to various surgical procedures. Significant increases seen in 1W (n=3) and 3W obstructed (n=5) kidneys but not in released kidneys (n=4) at 2W post-release. (C) qRT-PCR showed no significant differences in the Foxd1 gene expression between 3 week old sham (n=4), obstructed (n=6) and released (n=5) kidneys (**P<0.01; ***P<0.001; NS-non significant)

