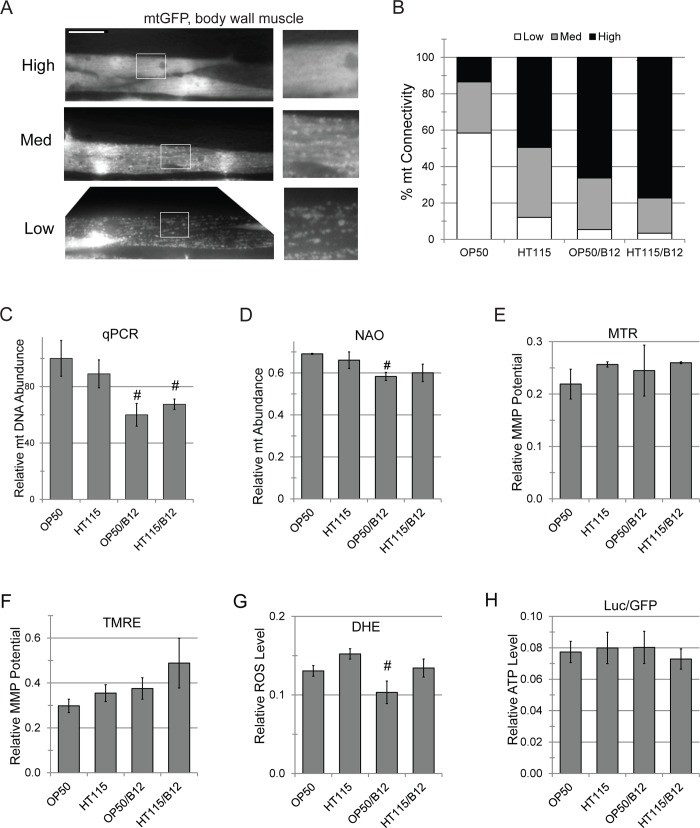
Fig 3. Methylcobalamin supplementation improves mitochondrial homeostasis.
(A) glp-4(bn2ts); zcIs14|myo-3::GFP(mt) worms, encoding a mitochondrially-targeted GFP were fed E. coli OP50 or E. coli HT115 with or without methylcobalamin supplementation. Body wall muscle mitochondria were imaged in the same tail cell of worms from each condition. Worms were grouped into high, medium, or low connectivity, as shown by inset images. (B) Quantification of mitochondrial phenotypes from (A). (C) Relative abundance of mitochondrial genome count in worms fed on E. coli OP50 or E. coli OP50 supplemented with methylcobalamin. (D) Measurement of mitochondrial membrane staining with nonyl-acridine orange (NAO). (E,F) Mitochondrial membrane potential, as determined by staining with MitoTracker Red (E) or tetramethylrhodamine ester (TMRE) (F), in worms fed as in (A). (G) Measurement of ROS production in worms, measured via fluorescence of dihydroethidium, fed as in (A). (H) ATP production in worms fed as in (A). Luminescence was normalized to GFP fluorescence to control for protein expression. *—p<0.05, p-value was calculated based on Student’s t-test. For (B) at least 30 worms were used per diet per biological replicate. For (C-G) at least 2,000 worms were used per biological replicate. For (H) at least 4 wells with 100 worms per well per condition per replicate. At least three biological replicates were performed for each experiment.

